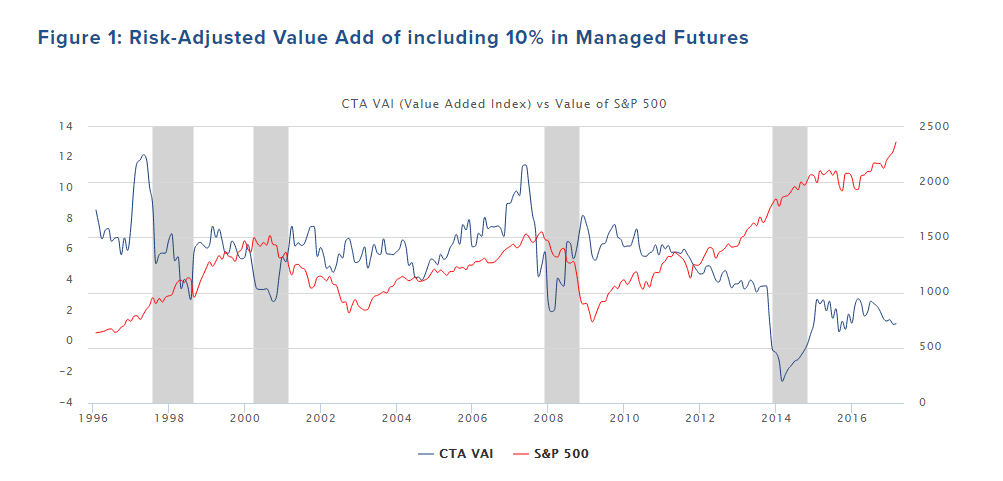
The CTA VAI (Value Added Index) - a tool for timing and understanding the value of managed futures
It seems like clockwork that whenever an investment strategy goes through a soft period of lackluster returns, the investment community questions its validity. You can almost set your watch to it. This seems particularly true for strategies that are divergent in nature, the most common of which are managed futures/CTA strategies.
Divergent return streams are characterized by many small losses followed by an occasional large gain, often at times of crisis or correction. Unlike feel-good convergent return streams, which produce many small gains followed by an occasional devastating loss, divergent strategies often feel like taking many small paper cuts, waiting patiently for a possible large return. For this reason, retail investors often struggle with this type of strategy, as they do not provide constant gratification through dividends or yield, but rather feel like waiting for a huge insurance payoff.
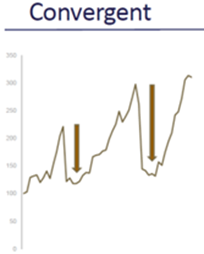

Seeing as most equity, fixed income and typical alternative (real estate, private equity, infrastructure) investment strategies produce a convergent return stream, one solution to creating a better portfolio, for any investor, is to add divergent alternative return streams to the typical convergent investments that dominate portfolios. Holdings that boast a negative or near-zero equity correlation but still produce positive returns over time are particularly valuable, as they’re able to still provide investors with moderate gains over the short-term, but really kick in once the markets decline.
To help understand the value of this return stream and managed futures in general, in 2014, we published a white paper on the CTA Value Added Index (“VAI™”), which illustrates that managed futures/CTA strategies consistently add risk-adjusted value not only in times of financial crisis, but over the long term as well, and that timing plays a significant role in improving portfolio performance when increasing risk-adjusted exposure.

A perfect example of this is gleaned from the graph above, which shows the additive risk-adjusted value of using managed futures within a portfolio. While the CTA VAI™ largely remained positive for the better part of two decades, in 2014, it briefly dipped into negative territory before fiercely rallying over a short period of time on the back of exceptional CTA performance despite the continued strength of the stock market. During this time, any investor who increased their CTA exposure was rewarded handsomely for their shrewd decision.
The best time to add CTA exposure is when the value of the CTA VAI™ has significantly dislocated from the S&P 500. This is why it is such a valuable tool to use when trying to time asset allocation perfectly in order to further improve portfolio performance.
At the time the CTA VAI™ whitepaper was written, the CTA sector had softened for three years and the investment "community" began questioning its validity as a result. However, the paper illustrates that adding CTA exposure to a simple portfolio of equities was still valuable over most time periods. It didn’t matter whether an investor added exposure in a time of financial crisis or when stocks were outperforming: over a rolling 60-month period, the index was mainly positive. This illustrates that whatever the current performance of the CTA benchmark, there is still an additive long-term risk-adjusted benefit to including managed futures within a portfolio.
Yet, despite the prevalence of long-term gains for portfolios including CTAs, timing shapes performance. Historically, the most valuable time to add CTA exposure is when the CTA VAI has significantly dislocated from the S&P 500 (grey sections in Figure 1 above in 1998, 2000, 2007, and 2014).
In 2016, with very few exceptions (all of Auspice’s products were positive), CTA strategies did not fare well while the equity market marched higher. This led to a widening of the spread between the index and S&P. Currently, the index’s value is still significantly dislocated from the S&P 500, sitting on the low end of the historical range at 1.16.
While this index does not predict the future, we can learn from facts from the past. At this time, the spread between CTA Value added Index and equities is starting to look stretched. Could it widen even further? Of course. However, it is at times like these that adding a divergent return stream seldom harms a portfolio materially, with the potential to help tremendously.