
Auspice Broad Commodity Index
Investment Objective
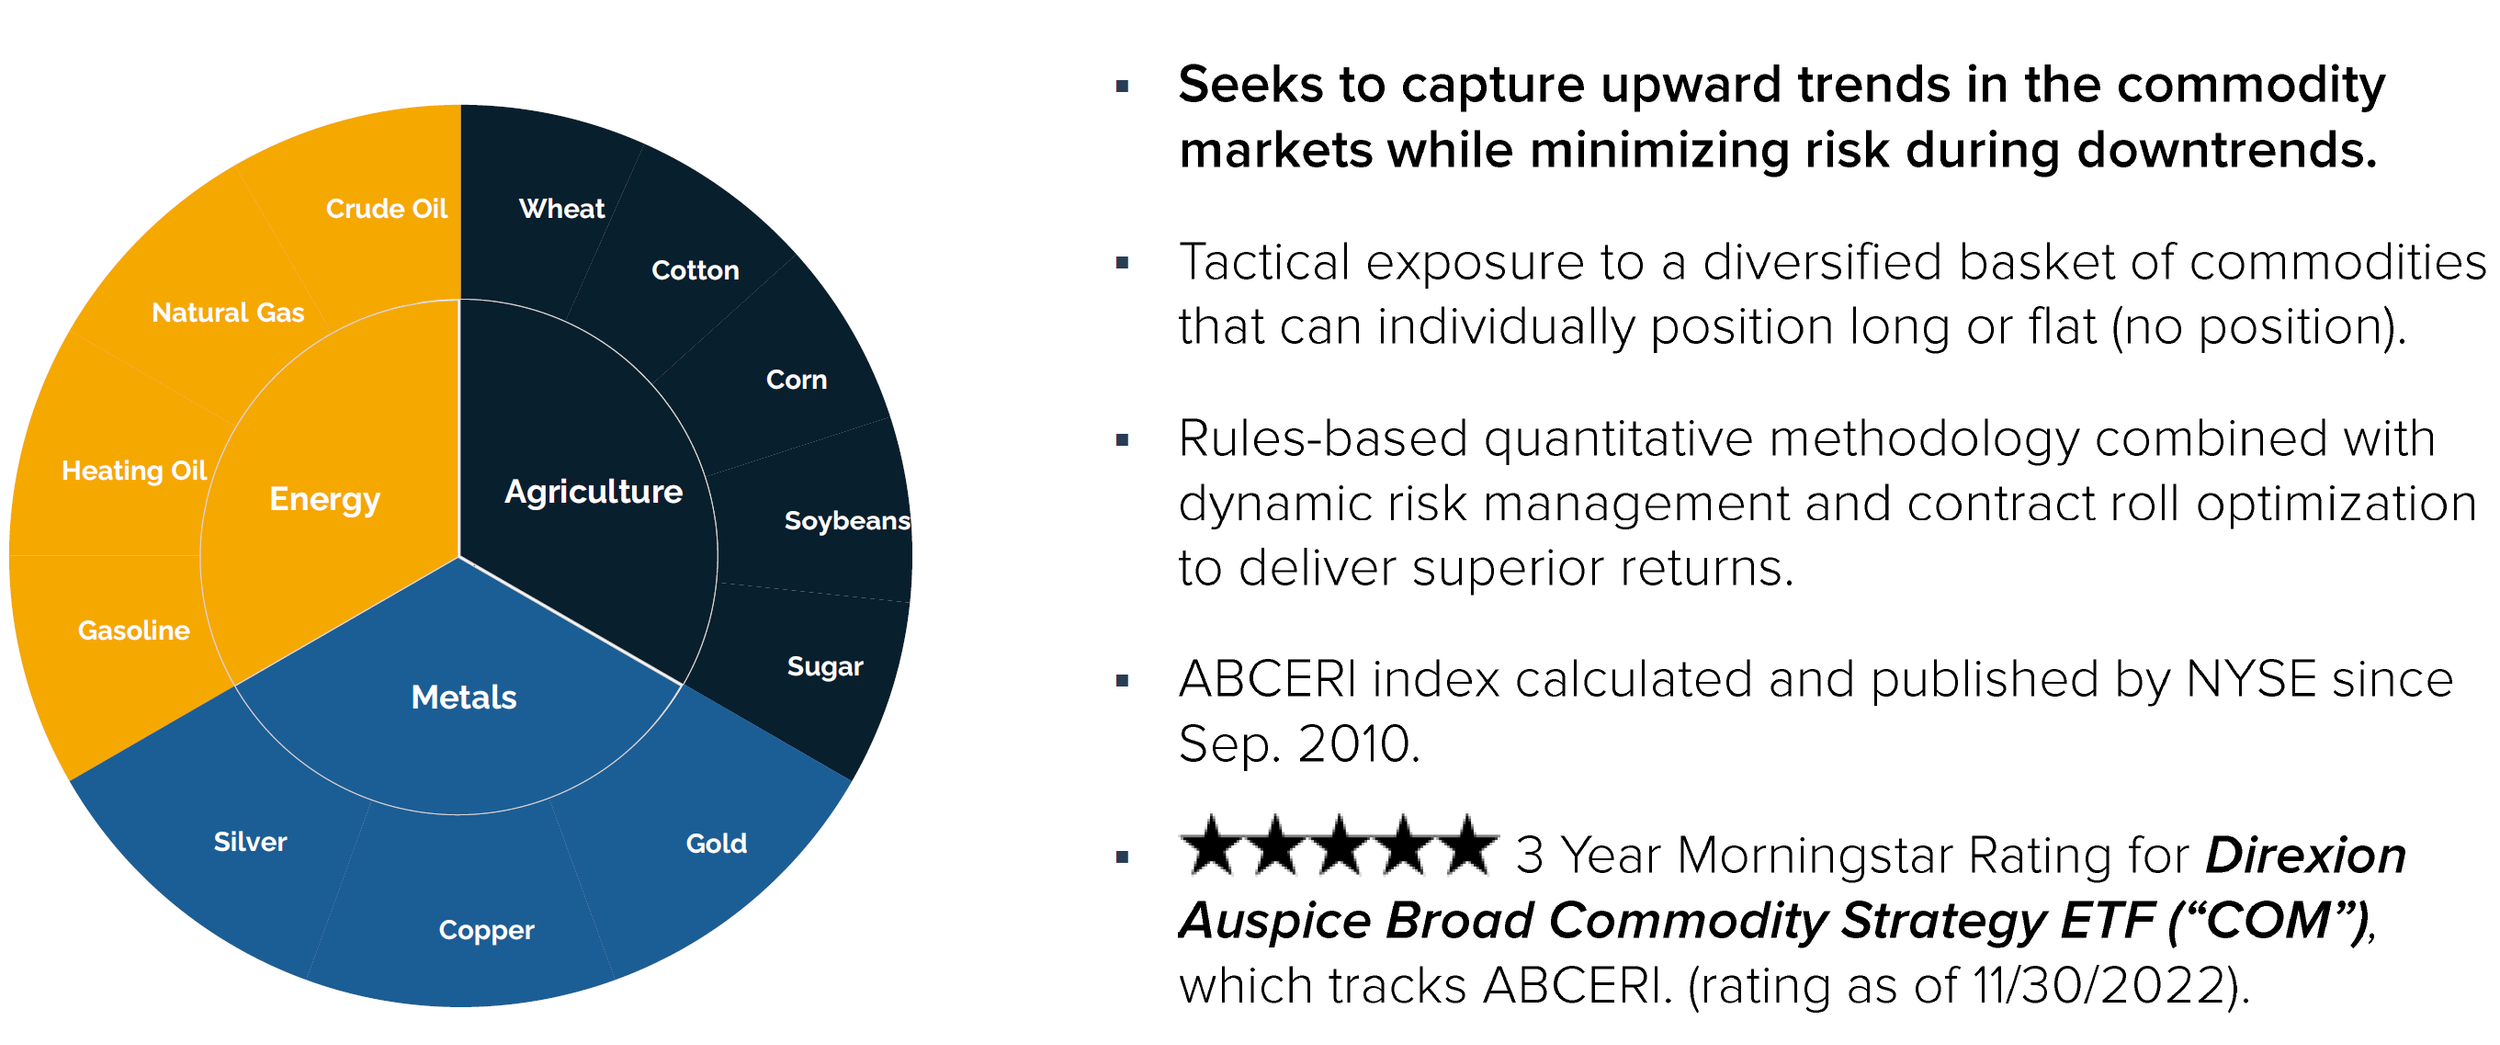
The Auspice Broad Commodity Index (ABCERI) aims to capture upward trends in the commodity markets while minimizing risk during downtrends.
Investment Strategy
Auspice Broad Commodity is a tactical long strategy that focuses on Momentum and Term Structure to track either long or flat positions in a diversified portfolio of commodity futures which cover the energy, metal, and agricultural sectors. The index incorporates dynamic risk management and contract rolling methods. The index is available in total return (collateralized) and excess return (non-collateralized) versions.
The Auspice Broad Commodity Index is available via:
Indexes: we publish our Indices 3rd party via NYSE
ETFs: through partner firms:
Managed Accounts ($20mm minimum)

| PERFORMANCE TABLE (Excess Return) | |||||||||||||
|---|---|---|---|---|---|---|---|---|---|---|---|---|---|
| YEAR | JAN | FEB | MAR | APR | MAY | JUN | JUL | AUG | SEP | OCT | NOV | DEC | RETURN |
| 2016 | -0.69% | 1.01% | 0.92% | 4.00% | 0.00% | 2.64% | 8.06% | ||||||
| 2015 | -2.13% | -0.18% | -1.64% | 0.99% | -1.78% | -0.08% | -7.77% | -1.59% | -0.27% | -0.01% | 0.13% | 0.29% | -13.45% |
| 2014 | -2.41% | 2.68% | -1.23% | 1.27% | -3.79% | 1.03% | -3.57% | -0.96% | -1.64% | 0.00% | 0.00% | -0.54% | -8.97% |
| 2013 | 2.45% | -2.32% | 0.87% | -1.42% | -0.55% | -0.27% | -0.11% | 1.03% | -2.26% | -1.57% | 0.56% | 0.39% | -3.27% |
| 2012 | 0.90% | 2.28% | 0.09% | -0.38% | -6.43% | 2.24% | 5.41% | -0.37% | 0.82% | -3.79% | 0.64% | -1.92% | -1.02% |
| 2011 | 2.44% | 4.23% | 1.96% | 4.32% | -5.11% | -2.84% | 2.88% | 0.73% | -6.28% | 0.59% | -0.46% | -1.25% | 0.54% |
| 2010 | -3.81% | 2.61% | 0.53% | 1.87% | -5.57% | -0.40% | 1.03% | 2.64% | 6.99% | 7.35% | 1.02% | 9.66% | 25.43% |
| 2009 | 0.00% | -0.66% | -0.24% | 0.01% | 5.78% | -5.49% | 2.20% | 2.80% | 0.39% | 2.52% | 4.00% | -0.66% | 10.69% |
| 2008 | 5.89% | 10.60% | -5.20% | 3.98% | 4.05% | 6.96% | -7.48% | -4.78% | -1.31% | 0.00% | 0.00% | 0.00% | 11.71% |
| 2007 | 0.90% | 2.39% | -1.25% | 0.33% | 0.13% | 2.44% | 1.74% | -0.83% | 7.48% | 4.05% | -2.42% | 6.42% | 23.04% |
| 2006 | 5.59% | -0.45% | 2.39% | 6.87% | 1.40% | -2.41% | 0.07% | -2.92% | -0.44% | 2.39% | 2.74% | -0.23% | 15.54% |
| 2005 | 0.40% | 4.37% | 0.75% | -3.87% | -2.18% | 2.07% | 1.75% | 5.95% | 3.24% | -4.19% | 2.93% | 5.32% | 17.16% |
| 2004 | 2.18% | 6.32% | 3.54% | -3.42% | -0.70% | -1.49% | 3.30% | -1.53% | 3.98% | 0.57% | 0.77% | -4.43% | 8.87% |
| 2003 | 6.32% | 2.27% | -7.68% | -1.86% | 2.82% | -2.92% | 1.80% | 2.04% | 0.32% | 6.34% | 0.16% | 5.95% | 15.63% |
| 2002 | -0.62% | -0.17% | 2.53% | -0.50% | 0.61% | 1.42% | -0.78% | 3.42% | 2.43% | -0.20% | -1.02% | 4.31% | 11.85% |
| 2001 | -1.78% | -0.07% | -1.33% | 2.07% | -2.34% | -2.22% | 0.48% | 0.77% | -1.53% | -1.11% | -0.33% | 0.21% | -7.04% |
| 2000 | 2.41% | 1.08% | -0.62% | -1.93% | 8.62% | 1.29% | -0.71% | 5.78% | -0.97% | -0.86% | 2.49% | -1.77% | 15.24% |
*Grey area represents index data simulated prior to third party publishing as calculated by the NYSE

*The performance of Auspice Broad Commodity Index prior to 9/30/2010 represents index data simulated prior to third party publishing as calculated by the NYSE from 1/1/2000. Source: Bloomberg and Auspice Investment Operations. You can not invest directly in an index. Performance as of December 31st, 2023.
Materials & Data
Monthly Commentary and Strategy Facts
Index Values & Monthly Performance Datasuite
Request Methodology Document
All performance data for all indices assumes the reinvestment of all distributions. To the extent information for the index for the period prior to its initial calculation date is made available, any such information will be simulated (i.e., calculations of how the index might have performed during that time period if the index had existed). Any comparisons, assertions and conclusions regarding the performance of the index during the time period prior to the initial calculation date will be based on back-testing. These results are based on simulated or hypothetical performance results that have certain inherent limitations. Unlike the results shown in an actual performance record, these results do not represent actual trading. Also, because these trades have not actually been executed, these results may have under-or over-compensated for the impact, if any, of certain market factors, such as lack of liquidity. Simulated or hypothetical trading programs in general are also subject to the fact that they are designed with the benefit of hindsight. No representation is being made that any account will or is likely to achieve profits or losses similar to these being shown. The index does not have commissions, management/incentive fees, or operating expenses.
DISCLAIMERS AND DEFINITIONS
The S&P Goldman Sachs Commodity Excess Return Index (S&P GSCI ER), is a composite index of commodity sector returns representing an unleveraged, long-only investment in commodity futures that is broadly diversified across the spectrum of commodities.
The Bloomberg Commodity (Excess Return) Index (BCOM ER), is a broadly diversified index that allows investors to track 19 commodity futures through a single, simple measure.
The MSCI ACWI (Net) Index, is designed to represent performance of the full opportunity set of large- and mid-cap stocks across 23 developed and 26 emerging markets.
The S&P/TSX 60 Index is designed to represent leading companies in leading industries. Its 60 stocks make it ideal for coverage of companies with large market capitalizations and a cost-efficient way to achieve Canadian.
The Deutsche Bank Liquid Commodity Optimum Yield Index (DB LCI OY), is an index composed of futures contracts on 14 of the most heavily traded and important physical commodities in the world.
Volatility: Measures how much the price of a security, derivative, or index fluctuates. The most commonly used measure of volatility when it comes to investment funds is standard deviation.
Sharpe Ratio: A risk-adjusted return measure calculated by using standard deviation and excess return to determine reward per unit of risk. The higher the Sharpe Ratio, the better the portfolio's historical risk-adjusted performance.
Max Drawdown: Measures the peak-to-trough decline of an investment or, in other words, the difference between the highest and lowest price over a given timeframe.
IMPORTANT DISCLAIMERS AND NOTES
Futures trading is speculative and is not suitable for all customers. Past results is not necessarily indicative of future results. This web page is for information purposes only and should not be construed as an offer, recommendation or solicitation to conclude a transaction and should not be treated as giving investment advice. Auspice Capital Advisors Ltd. makes no representation or warranty relating to any information herein, which is derived from independent sources. No securities regulatory authority has expressed an opinion about the securities offered herein and it is an offence to claim otherwise.
Commissions, trailing commissions, management fees and expenses all may be associated with mutual fund investments. Please read the prospectus before investing. The indicated rates of return are the historical annual compounded total returns including changes in share and/or unit value and reinvestment of all dividends and/or distributions and do not take into account sales, redemption, distribution or optional charges or income taxes payable by any securityholder that would have reduced returns. Mutual funds are not guaranteed, their values change frequently and past performance may not be repeated.
The commentaries contained herein are provided as a general source of information based on information available at the time of publication and are not intended to be comprehensive investment advice applicable to the circumstances of the individual. Every effort has been made to ensure accuracy in these commentaries at the time of publication; however, accuracy cannot be guaranteed. Market conditions may change and Auspice Capital Advisors Ltd. accepts no responsibility for individual investment decisions arising from the use of or reliance on the information contained herein.
Certain statements in this document are forward- looking statements, including those identified by the expressions “anticipate”, “believe”, “plan”, “estimate”, “expect”, “intend”, “target”, “seek”, “will” and similar expressions to the extent they relate to the Fund and the Manager. Forward- looking statements are not historical facts but reflect the current expectations of the Fund and the Manager regarding future results or events. Such forward-looking statements reflect the Fund’s and the Manager’s current beliefs and are based on information currently available to them. Forward-looking statements are made with assumptions and involve significant risks and uncertainties. Although the forward-looking statements contained in this document are based upon assumptions that the Fund and the Manager believe to be reasonable, none of the Fund or the Manager can assure investors that actual results will be consistent with these forward-looking statements. As a result, readers are cautioned not to place undue reliance on these statements as a number of factors could cause actual results or events to differ materially from current expectations.
The forward-looking statements contained herein were prepared for the purpose of providing prospective investors with general educational background information about the Funds and may not be appropriate for other purposes. None of the Fund or the Manager assumes any obligation to update or revise them to reflect new events or circumstances, except as required by law.
Auspice is an innovative alternative asset manager that focuses on applying rules-based investment strategies across a broad range of commodity and financial markets. Auspice offers liquid alternative and commodity strategies that provide the benefits of active management and the efficiency of indexing. Auspice works with a wide range of clients and develops solutions to improve their portfolio or product suite. Auspice strategies are available directly to institutions, financial professionals and high-net-worth individual investors as well as retail investors through the Auspice brand along with sub-advisory and licensing arrangements. www.auspicecapital.com