
February was volatile and any sanctions or coordinated responses may pose long term market ramifications. However, the Russian invasion of Ukraine mostly accentuated underlying fundamental themes already in motion:
We’re in a structural commodity deficit that may affect markets broadly for years. A decade of declining capex across the asset class is becoming pronounced not just in current market prices but also in the forward term structure of commodities (contango versus backwardation).
Gains in commodities versus weakness in equities suggests cyclical rotation is underway. A key reversal in the decade long outperformance of technology vs energy stocks (XLK:XLE) has taken place along with a potential reversal in the longer-term commodity to equity ratio (GSCI:SP500).
Ukraine’s Agricultural Importance.
For most countries, the main economic impact of the crisis will come through higher commodity prices and the impact on inflation, which in Europe could rise by as much as 2%(1).
While much of the focus has been on energy, the biggest dislocations are taking place in agriculturals such as corn and wheat. Ukraine is an important agricultural country:
1st in Europe in terms of arable land area;
3rd place in the world by the area of black soil (25% of world’s volume);
1st place in the world in exports of sunflower and sunflower oil;
2nd place in the world in barley production and 4th place in barley exports;
3rd largest producer and 4th largest exporter of corn in the world;
4th largest producer of potatoes in the world;
5th largest producer of wheat and rye in the world.
With a population of just 40 million people it can meet the food needs of 600 million people.
Ukraine is also 1st in Europe in proven recoverable reserves of uranium ores and has the second largest iron ore reserves in the world.
Commodity Backdrop
Broad Commodity Backwardation
Commodities trade in backwardation, where near-term prices are higher than those further out, when markets are in short supply. As of February 7th (prior to the escalation and sanctions) there were more commodities in backwardation than any time this century. From energies to agricultural to metals – the world was already facing historic shortages (see Chart 1).
Chart 1: Record Number of Commodities in Backwardation.
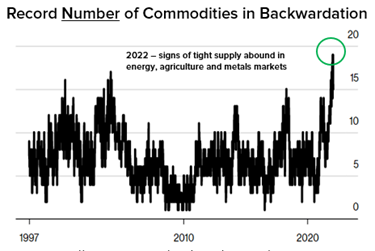
Source: Auspice Capital and https://www.bloomberg.com/news/articles/2022-02-08/the-commodity-gauges-that-underpin-goldman-s-uber-bullish-view
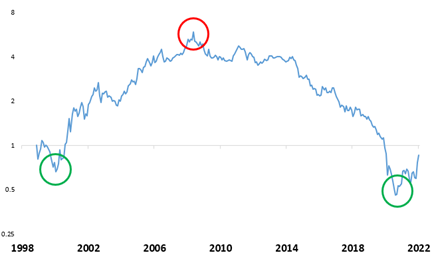
Energy Backwardation
As global economies shut down In March 2020 a supply glut in WTI Oil led to historic levels of contango and ultimately all-time historic low to negative oil prices.
In January 2022, prior to the Ukrainian invasion, WTI oil reached new extremes on the opposite end with record levels of backwardation – the tightest oil market in over fifty years. While the Ukrainian conflict has accentuated volatility, structural supply shortages were already driving prices up.
Chart 2: Record Level of WTI Oil Backwardation.

Source: Auspice Capital
The extreme backwardation and supply shortages reflect the lack of energy investment over the last decade (Chart 3 below), consistent with declining capex (capital expenditure) more broadly across commodity sectors (see Metals Chart 4 below).
Chart 3: Decline in US Aggregate Oil and Gas CAPEX Since 2014.

Source: Otavio Costa & Crescat Capital LLC, Twitter Feb 21st
Chart 4: Decline in Metals CAPEX Since 2012.

Source: S&P Global Market Intelligence
With lead times of 7 to 10 plus years to develop mining and energy infrastructure, the idea that supply can quickly catch up to demand, or that supply chain resolution will alleviate tight inventories is largely unfounded. To be clear, the world was facing structural commodity shortages pre-COVID and Ukrainian conflict.
Investment implications
XLE/XLK Relative Performance (Ratio) Chart
Strength in energy stocks and weakness in technology looks to have reversed a cyclical trend that commenced in 2009. While the recent outperformance of energy to technology has been significant, the long-term view suggests the rotation could still be in its early days. This aligns with the more broad commodity to equity ratio with is lifting off cyclic lows.
Chart 5: Energy to Technology (XLE:XLK) Relative Performance (Ratio) Chart.
Source: Auspice Capital
GSCI/SP500 Relative Performance (Ratio) Chart
The long-term commodity to equity ratio (value) chart has a long track record of confirming secular rotations. The most recent price action in stock and commodities is an important shift but minor in the long-term view.
Chart 6: Commodity to Equity (GSCI TR:SP500) Relative Performance (Ratio) Chart, long term.

Source: Auspice Capital
Notably if we zoom in to the period since the global financial crisis the reversal (energy stocks are now outperforming) is more evident.
Chart 7: Commodity to Equity (GSCI TR:SP500) Relative Performance (Ratio) Chart, since 2008.

Source: Auspice Capital
Summary
At Auspice we believe it imperative that investors recognize that a potential regime change has taken place. Last decade was marked by unprecedented accommodative monetary policy and quantitative easing that artificially compressed volatility and interest rates while buoying global equities and bonds. Central banks are now stepping back from their bond buying programs, rates are increasing, and inflation/volatility has returned alongside an existing structural supply deficit that exists across the broad and diverse commodity sector.
The outcome of the Russian war in Ukraine could pose long term implications on capital markets, supply and inflation, further exacerbating the issue.
Strategies that performed well in the previous decade might not be adequate in this new environment.
To learn more about Auspice Commodity Strategies email us today at info@auspicecapital.com
References
https://www.capitaleconomics.com/clients/publications/emerging-europe-economics/emerging-europe-economics-update/counting-the-cost-of-sanctions-on-russia/
Disclaimer below
IMPORTANT DISCLAIMERS AND NOTES
Futures trading is speculative and is not suitable for all customers. Past results are not necessarily indicative of future results. This document is for information purposes only and should not be construed as an offer, recommendation or solicitation to conclude a transaction and should not be treated as giving investment advice. Auspice Capital Advisors Ltd. makes no representation or warranty relating to any information herein, which is derived from independent sources. No securities regulatory authority has expressed an opinion about the securities offered herein and it is an offence to claim otherwise.
QUALIFIED INVESTORS
For U.S. investors, any reference to the Auspice Diversified Strategy or Program, “ADP”, is only available to Qualified Eligible Persons “QEP’s” as defined by CFTC Regulation 4.7.
For Canadian investors, any reference to the Auspice Diversified Strategy or Program, “ADP”, or Auspice One Fund “AOF”, is only available to “Accredited Investors” as defined by CSA NI 45-106.