This month we’re highlighting an important chart, the long-term commodity and equity chart (Chart 2).
March produced some of the highest levels of volatility in commodities in years - Energies, Grains, and Industrial Metals, notably Nickel, captured headlines as the LME cancelled and then halted trading.
Some commentators pointed to the recent highs and suggested prices to be extended or overbought. On various news platforms we saw several overly complicated, abstract indicators suggesting this.
Chart 1: Commodity Bear Market Breakout

While the intramonth highs may have been extended on a short-term basis, the long-term monthly chart (and returns) is, for most investors, arguably most important.
Like many CTAs, Auspice mainly trades off price-based trends. Abstract indicators make for great conversation, but generally poor trading signals. Simple price-based trend-following has proven to be arguably the most effective active trading strategy as demonstrated by returns delivered by real money managers, evidenced by the various CTA indexes for 40+ years.
In March, while the more diversified and tactical Auspice Broad Commodity Index again made new highs, the S&P GSCI closed well below highs experienced in 2008 (Chart 2 below), and at this point the GSCI has just begun reversing losses from the recent bear market. While there was an intramonth reversal in many commodities, the medium- and long-term trend is clearly “up”, with the recent price appreciation in the GSCI rather insignificant in the long-term view.
At Auspice we believe we are perhaps in the second inning of a commodity supercycle, similar to the one experienced from 1970 – 2007, and many investors are ill-prepared.
Chart 2: Long Term Commodity and Equity Returns
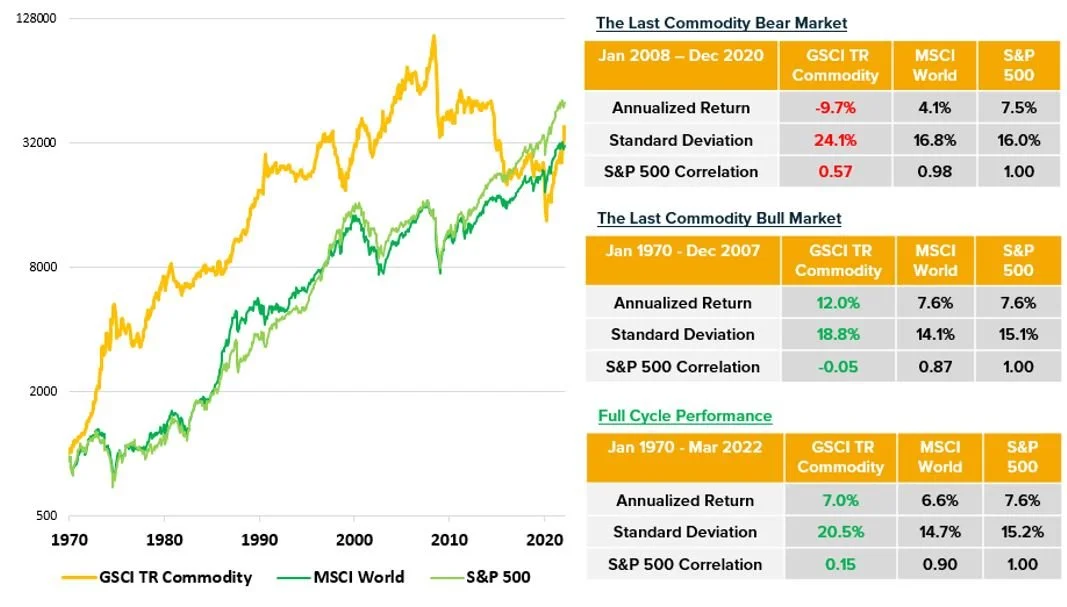
As depicted in Chart 2, from 1970 to 2007 the benchmark GSCI Commodity Index outperformed both the SP500 and MSCI World. With equities valuations at historical highs and commodity supply at record lows (see last month’s blog) we believe commodity outperformance vs equities will be even more significant this decade, maybe even a generational opportunity, eclipsing the outperformance experienced 1970 – 2010.
Disclaimer below
IMPORTANT DISCLAIMERS AND NOTES
1. The S&P 500 is an index of 500 stocks chosen for market size, liquidity and industry grouping, among other factors. The S&P 500 is designed to be a leading indicator of U.S. equities and is meant to reflect the risk/return characteristics of the large cap universe. Price Return data is used (not including dividends).
2. The (MSCI) World Index, Morgan Stanley Capital International, is designed to measure equity market performance large and mid-cap equity performance across 23 developed markets countries, covering approximately 85% of the free float-adjusted market capitalization in each. This index offers a broad global equity benchmark, without emerging markets exposure.
3. The Auspice Broad Commodity strategy combines opportunistic commodity exposure with capital preservation. Returns for Auspice Broad Commodity Excess Return Index or “ABCERI” represent returns calculated and published by the NYSE. ABCERI index calculated and published by NYSE since Sep. 2010. The index does not have commissions, management/incentive fees or operating expenses. The Auspice Broad Commodity Total Return (“TR”) Index includes the return on cash collateral.
4. The Barclay BTOP50 CTA Index seeks to replicate the overall composition of the managed futures industry with regard to trading style and overall market exposure. The BTOP50 employs a top-down approach in selecting its constituents. The largest investable trading advisor programs, as measured by assets under management, are selected for inclusion in the BTOP50.
5. The S&P Goldman Sachs Commodity Excess Return Index (GSCI TR), is a composite index of commodity sector returns representing an unleveraged, long-only investment in commodity futures that is broadly diversified across the spectrum of commodities. The GSCI Total Return (“TR”) Index includes the return on cash collateral.
Futures trading is speculative and is not suitable for all customers. Past results are not necessarily indicative of future results. This document is for information purposes only and should not be construed as an offer, recommendation or solicitation to conclude a transaction and should not be treated as giving investment advice. Auspice Capital Advisors Ltd. makes no representation or warranty relating to any information herein, which is derived from independent sources. No securities regulatory authority has expressed an opinion about the securities offered herein and it is an offence to claim otherwise.
QUALIFIED INVESTORS
For U.S. investors, any reference to the Auspice Diversified Strategy or Program, “ADP”, is only available to Qualified Eligible Persons “QEP’s” as defined by CFTC Regulation 4.7.
For Canadian investors, any reference to the Auspice Diversified Strategy or Program, “ADP”, or Auspice One Fund “AOF”, is only available to “Accredited Investors” as defined by CSA NI 45-106.