We’ve seen several articles using the term “return stacking” over the past couple years including a way to using leverage in a retail portfolio as described by ReSolve Asset Management and Newfound Research. However, at its heart, this is an approach to alternative investing long embraced by institutional investors that’s increasingly available to retail investors, now in a single fund solution.
Indeed, at Auspice we have long offered (and advocated) for this approach with institutional investors, and in 2020 we made this strategy available to all investors through the Auspice One Fund.
What exactly is return stacking, why should you consider it, where does it fit within a portfolio, and how has it performed in the recent environment? This month’s blog provides an overview.
What is Return Stacking?
Long known as “portable alpha” and “overlays”, return stacking is a strategy that has been practiced by institutional investors for decades. Our partners at RCM actually found a reference to portable alpha all the way back to 1982 in a CME educational piece:
Source: https://www.cmegroup.com/education/courses/portfolio-management-with-equity-index-futures-and-options/alpha-beta-and-portable-alpha.html
At its core, return stacking generally is the combination of strategies, often an “alpha” and a “beta” strategy, into a single portfolio or fund. One of these components, the alpha or the beta, is generally attained through cash efficient derivatives. Given futures require only a small percentage of capital versus the gross notional exposure, capital can be used to create multiple exposures. As such, leverage is employed, but generally (and importantly) in a risk reducing manner.
Consider the example below of a 100% allocation to a CTA benchmark, the BTOP50, on top of a 100% allocation to a Traditional 60/40 portfolio. As per the bottom row, the returns are actually slightly more than the sum of the parts due to the non-correlation of the strategies and rebalancing.

Notably however the resulting risk metrics are not the sum of the parts – the risk as measured by “volatility” does not increase proportionally and is lower than the standalone volatility of the S&P 500. The worst drawdown is actually lower than the traditional 60/40 portfolio despite the use of leverage – this over a period of almost 35 years. This is again due to the non-correlation of the two portfolios and is a key differentiator between return stacking and more traditional uses of leverage that tends to magnify volatility and drawdown – rather than reduce it.
Why Return Stacking?
Return stacking, particularly when done with uncorrelated and even negatively correlated strategies can produce more attractive risk-adjusted returns.
Ultimately the question of “Why” will come down to each investor and their unique considerations and portfolio objectives.
Is your goal with a prospective investment portfolio diversification? Are you able to take a holistic approach to portfolio management and evaluate your portfolio by the sum of its parts?
Or, is your goal more aligned with returns enhancement? Do you have a board or end clients that might be disappointed if an alternative strategy underperforms traditional investments over some time periods?
One of the benefits of return stacking solutions is that they address the human biases that investors – retail and institutional alike – often are faced with. Namely, while we like to think we can take a holistic total-portfolio approach to investing, often investments are evaluated on a line-by-line basis, and periods of underperformance can lead to divestment at inopportune times. Return stacking, when done effectively, can lead to higher stand alone and risk-adjusted returns – a better experience for most investors.
However, there can be drawbacks depending on the objective or role of an investment. If for example you already have significant equity risk and your objective is diversification or risk mitigation, you may be better served with a dedicated diversifying strategy, such as a negatively or non-correlated trend-following CTA.
For example, as of June 2022 our flagship Auspice Diversified (Series X) was +17.6% YTD whereas our return-stacking Auspice One Fund (Series A) was +1.0% YTD, with the “traditional” component of the Auspice One Fund weighing on returns. We expect the Auspice One Fund to outperform full cycle, however in equity market sell-offs, many CTAs like Auspice Diversified will tend to outperform.
There tends to be a spectrum of returns that considers equity correlation and risk-adjusted returns (Sharpe). On the left side are your pure and most reliable diversifiers: tail-hedge strategies. These strategies have a strong negative equity correlation but generally a low or even negative Sharpe, and thus are not practical for most investors. In the middle you have Trend-Following CTAs that can have a low or even negative equity correlation. These tend to be most accretive to portfolios, albeit with Sharpe Ratios that don’t always stand out when correlation isn’t considered. CTAs tend to be the most practical diversifiers and largest components of “Crisis-Risk Offset” and “Risk-Mitigating Strategies” in portfolios of large pensions and sovereign wealth plans (see more on this here).
Finally, on the right side of the spectrum are return stacking portfolios that have higher Sharpe ratios albeit with some beta or equity correlation. For investors seeking returns enhancement and single fund solutions, return-stacking portfolios may be most practical.

Where Does a Return Stacking Portfolio Fit?
One question we frequently receive is “where” does such a strategy belong? Generally, most Trend-Following CTAs and commodity strategies would belong in an “Alternative”, “Hedge Fund”, “Inflation-Protection”, or “Diversifying” sub-portfolio.
In the case of a return stacking portfolio, we would recommend that the largest beta or risk factor likely is the best determinant of where a strategy belongs. For example, with the Auspice One Fund we overlay our core CTA alpha strategies on top of a traditional-like portfolio which is most influenced (~70%) by equity risk. Accordingly, we would recommend it sit in an equity portfolio, and generally our investors thus far have utilized the strategy as an “equity-replacement”.
Perhaps you want to maintain equity exposure but are uncertain about the outlook given rising rates, inflation and other factors? In this case a return stacking portfolio such as the Auspice One Fund may be a compelling solution.
How Has Return Stacking Performed?
We think Auspice’s return stacking solution, the Auspice One Fund, is unique. However, we are not alone in the category with two main competitors that have generated strong performance across several environments with funds available to US investors.
The Abbey Capital Multi Asset fund Class I launched in April 2018 and has annualized a +11.82% return through June 2022. The Catalyst/Millburn fund has the longest track record having launched in late 2015 and the Class I share class boasts a +9.29% return since inception through June 2022.
Notably, despite the equity and bond selloff, both funds have continued to perform well in 2022 with Abbey +4.88% (Class I) and Catalyst/Milburn +2.93% (Class I) through June.
Auspice One Fund
We launched the Auspice One Fund in 2020 for a number or reasons:
It’s how we manage our own money.
Retail investors in Canada should have access to the same solutions institutional and US investors have.
For some investors, it’s a more practical approach to adding diversification while maintaining equity and fixed income exposure.
We saw room for improvement with existing solutions.
In the Auspice One Fund we essentially “stack” our core protective CTA strategies on top of a traditional portfolio. We could have left it just at that – an overlay of our flagship Auspice Diversified’s net returns on top of a 60/40 “Traditional” portfolio generates compelling risk and return metrics.

Beyond the basic 100% ADP (Auspice Diversified) + 100% Traditional (60% MSCI ACWI, 40% Barclay’s Agg) combination we saw some obvious areas for improvement, particularly in terms of further diversification and risk management. In summary, we added a small allocation to gold in the traditional portfolio, and a long/flat trend-following overlay on 50% of the traditional portfolio to better manage risk. The annualized return for the Auspice One Fund is slightly better than the more basic 100% + 100% combination however there are significant improvements in risk metrics including lowered volatility and worst drawdown along with a higher Sharpe and lower correlation to equities.
The above Auspice One Fund performance is hypothetical prior to November 2020, however the live results (below) have proved consistent with our targets at over 12% annualized inception, arguably a very challenging period
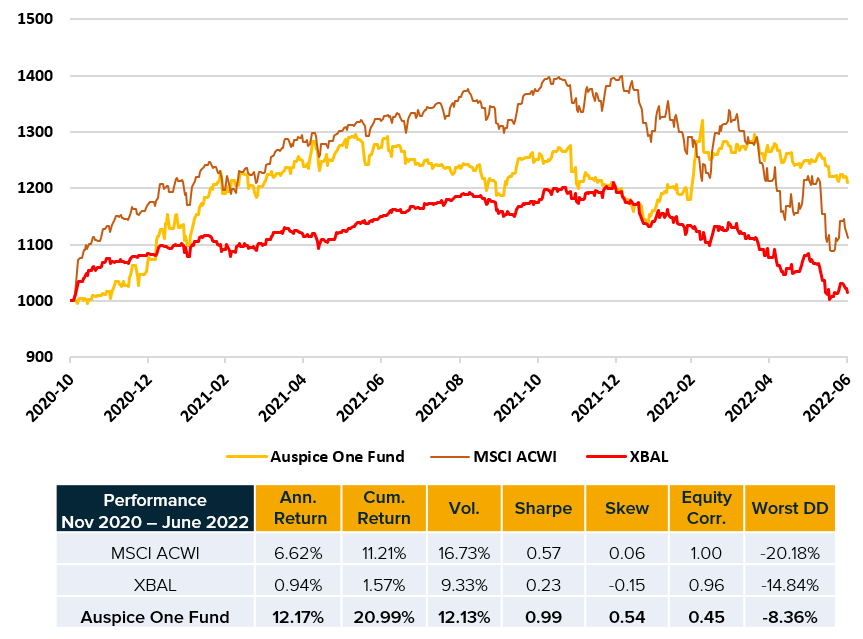
Auspice One Fund has outperformed benchmarks MSCI ACWI (equity) and XBAL (Balance Fund ETF) with a low equity correlation and lower drawdown.
Return Stacking Summary
While the term “return-stacking” may be new, the concept has been practiced for decades as “portable alpha” and “overlays” by institutional investors – the innovation mainly being in the increased retail solutions employing the concept. At Auspice we are always innovating and proud to bring this concept to Canadian investors.
As we enter a new regime in which traditional equities, bonds, and real estate returns may be compressed, return stacking solutions increasingly may fill gaps in investors portfolios.
For more information on return stacking and/or our solution, the Auspice One Fund, please email info@auspicecapital.com
Disclaimer below
IMPORTANT DISCLAIMERS AND NOTES
1. The MSCI ACWI Index, is designed to represent performance of the full opportunity set of large- and mid-cap stocks across 23 developed and 26 emerging markets.
2. The S&P 500 is an index of 500 stocks chosen for market size, liquidity and industry grouping, among other factors. The S&P 500 is designed to be a leading indicator of U.S. equities and is meant to reflect the risk/return characteristics of the large cap universe. Price Return data is used (not including dividends).
3. The XBAL ETF seeks to provide long-term capital growth and income by investing primarily in one or more exchange-traded funds managed by BlackRock Canada or an affiliate (iShares ETFs) that provide exposure to equity and/or fixed income securities.
4. The Bloomberg Barclay’s Aggregate Bond Index is a broad base, market capitalization-weighted bond market index representing intermediate term investment grade bonds traded in the United States. Investors frequently use the index as a stand-in for measuring the performance of the US bond market.
5. The Barclay BTOP50 CTA Index seeks to replicate the overall composition of the managed futures industry with regard to trading style and overall market exposure. The BTOP50 employs a top-down approach in selecting its constituents. The largest investable trading advisor programs, as measured by assets under management, are selected for inclusion in the BTOP50.
6. Track record of Auspice Diversified Program (ADP) has been available and audited since 2006. Unless otherwise noted, the returns for Auspice Diversified Program ("ADP") are estimates using 1% management fee and 15% performance fee for analysis purposes. The returns are based on actual "gross" returns (less management and performance fees, interest and expenses) plus illustrated management and performance fee similar to the Series X fund structure which started in July 2014.
7. Prior to November 2020, the Auspice One Fund returns are hypothetical, net of estimated fees. November 2020 forward returns represent live net returns from Auspice One Fund Series A.
8. Performance for Abbey Capital Multi Asset fund Class I (MAFIX) retrieved from:
9. Performance for Catalyst/Millburn Hedge Strategy Fund Class I (MBXIX) retrieved from:
b. https://catalystmf.com/funds/catalyst-millburn-hedge-strategy-fund/
Futures trading is speculative and is not suitable for all customers. Past results are not necessarily indicative of future results. This document is for information purposes only and should not be construed as an offer, recommendation or solicitation to conclude a transaction and should not be treated as giving investment advice. Auspice Capital Advisors Ltd. makes no representation or warranty relating to any information herein, which is derived from independent sources. No securities regulatory authority has expressed an opinion about the securities offered herein and it is an offence to claim otherwise.
QUALIFIED INVESTORS
For U.S. investors, any reference to the Auspice Diversified Strategy or Program, “ADP”, is only available to Qualified Eligible Persons “QEP’s” as defined by CFTC Regulation 4.7.
For Canadian investors, any reference to the Auspice Diversified Strategy or Program, “ADP”, or Auspice One Fund “AOF”, is only available to “Accredited Investors” as defined by CSA NI 45-106.