
Commissions, trailing commissions, management fees and expenses all may be associated with mutual fund investments. Please read the prospectus before investing. The indicated rates of return are the historical annual compounded total returns including changes in share and/or unit value and reinvestment of all dividends and/or distributions and do not take into account sales, redemption, distribution or optional charges or income taxes payable by any securityholder that would have reduced returns. Mutual funds are not guaranteed, their values change frequently and past performance may not be repeated. Source of data is Bloomberg unless otherwise indicated. The information contained herein is derived from sources which are believed to be reliable and every effort has been made to ensure the accuracy of its contents.
Publication Date: April 4th 2023
On the back of the US banking crisis which created a rapid shift in fixed income markets, the benchmark CTA indexes (BTOP50 and SG CTA) dropped 5 to 6.5% and experienced 7 to 9% peak to trough drawdowns. Some of the most popular CTA ETFs, typically with more concentrated positioning, were down twice as much from peak to trough. Auspice Diversified Trust, our flagship CTA fund, delivered a slight positive result in March, up 0.34%.
The long only broad commodity indexes also came under pressure in March with the S&P GSCI ER benchmark index experiencing a 9.38% drawdown, ending off 1.5%. The tactical trend-following Auspice Broad Commodity Index, on the other hand, had just a 0.86% peak to trough drawdown and finished the month positive, up 3.23% for 9%+ outperformance year-to-date. The COM & CCOM ETFs tracking the index, with an additional cash return, faired even better, up 4.0% & 3.6% respectively.
What are we doing different? Why are we outperforming?
There are times when our performance will resemble benchmarks. There are times when we will underperform our benchmarks as well. However, there are two important differentiators that we believe are most responsible for our long-term outperformance versus benchmarks:
Portfolio Construction
Risk Management
…Don’t bet the Farm!
1 - Portfolio Construction
Whether the Auspice Broad Commodity Index, our flagship Auspice Diversified Trust, or our new multi-strategy the Auspice One Fund, our portfolios are intentionally constructed to be more diversified than peer and benchmark products.
In the Auspice Broad Commodity Index (“ABCERI”) each market and each sector receives an equal risk weighting. This is quite different from the commodity benchmarks indexes which, although trade a higher number of markets, are heavily concentrated in risk. The S&P GSCI Index for example has 61% of risk in energy and over 40% in oil markets alone[i]. For a broad commodity index this is not diversified in our opinion. Portfolio construction is one of the key reasons we believe ABCERI has outperformed the GSCI by over 5% annualized with less than half the volatility and maximum drawdown since 2010 inception. The philosophy is to be long what is moving up and sit on the sidelines otherwise.
In our flagship Auspice Diversified Trust we have had an average 75% of portfolio risk in commodities since inception. This is quite different from our financially focused CTA peers which typically only have 20-40% of their portfolio in commodities. Anyone who has met with Auspice founder Tim Pickering or heard him on a webinar has probably heard him saying something along the lines of “coffee is not like cotton, is not canola, is not like crude”.
Commodity markets have lower correlations to each other than financial markets and allow for more diversification within a portfolio. Moreover, we don’t “bet the farm” on any single market or sector but rather place bets across seven sectors and spread risk within markets. Our financially focused peers likely trade more markets, but often these markets have much higher correlations, and resulting portfolios have less diversification (or fewer real diversified “bets”).
Our agile focus on commodities is one of the key reasons we avoided the drawdowns many of our peers experienced this month, and also one reason why we have had just a maximum 26% drawdown in 17 years and only 8% since January 2020 as this paradigm shifted.
2 – Risk Management
Auspice employs multiple risk management tools, a full overview of which is beyond a blog post. In our flagship Auspice Diversified Trust there is one thing however we find we do quite differently than many of our peers, and that is the use of “volatility stops”.
When the volatility of a market expands to an extreme level we may exit a position even if it still is in a trend. We are just as concerned about losing mark to market gains as we are losing initial investor capital. When the volatility of a market expands to extreme levels the probability of holding onto profits diminishes rapidly and we simply (and systematically) walk away. This effectively captures trends and reduces the volatility of our returns along with the amount of capital required on margin – freeing more capital to earn a cash return (averaging over 90%). It is also this risk management process that has protected us from some of the largest drawdowns our peers have faced over the years.
Sometimes the result may be that we exit a trend too early, leaving profits on the table. However, all the time, it results in less risk – and risk management is always the top priority at Auspice.
Final Thoughts
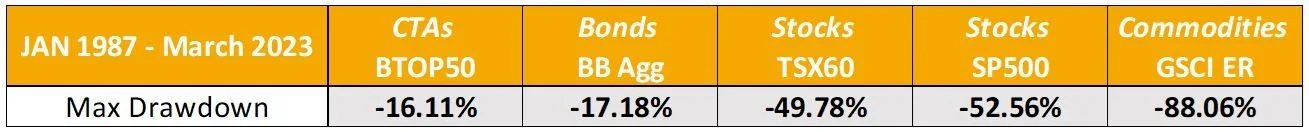
While we believe the large drawdowns experienced by some of our peers demonstrate how concentrated some CTA portfolios are despite often trading more markets, it’s important to put this drawdown in context. Notably, the benchmark BTOP50 CTA index, comprised of the largest 21 CTA funds open to investment, has a history going back to 1987. Over this period it has experienced a maximum peak to trough drawdown of just -16.11%, far lower than equity and commodity markets, and even lower than bonds.
Source: Auspice Capital Advisors and Bloomberg. See index definitions at the end. For more on CTA performance see our latest “Ten Reasons to Invest”, here.
Also, we are excited to highlight that the Auspice Broad Commodity index closed at eight-month highs last month. The recent lack of performance in the more concentrated commodity benchmarks muddle the fact that some commodities are again trending up. At Auspice we have been building positions across portfolios. Our bullish fundamental outlook appears to again be confirmed by price trends as many commodities, particularly in the Metals and Ag sectors, resume upwards trends.
Commodities, like all markets, don’t go straight up. After a strong move to kick-off the decade there has been consolidation over the last year. However, the fundamental backdrop hasn’t changed in our opinion, and it appears the next leg up may have resumed.
For more information please reach out to info@auspicecapital.com.
Disclaimers Below
INDEX DEFINITIONS
The BTOP50 seeks to replicate the overall composition of the managed futures industry with regard to trading style and overall market exposure. The largest investable trading advisor programs, as measured by assets under management, are selected for inclusion in the BTOP50. For 2023 there are 21 CTA funds in the Barclay BTOP50 Index. The BTOP 50 is the most comparable index for Auspice Diversified Trust, however there are significant differences, such as the average exposure to commodity futures (versus financial futures), and average trade length. Reference to the BTOP50 benchmark does not imply that Auspice Diversified Trust will achieve similar performance.
The SG CTA Index provides the market with a reliable daily performance benchmark of major commodity trading advisors (CTAs). The SG CTA Index calculates the daily rate of return for a pool of CTAs selected from the larger managers that are open to new investment. Second to the BTOP50, the SG CTA is the most comparable index for Auspice Diversified Trust, however there are significant differences, such as the average exposure to commodity futures (versus financial futures), and average trade length. Reference to the SG CTA benchmark does not imply that Auspice Diversified Trust will achieve similar performance.
The S&P Goldman Sachs Commodity Excess Return Index (“GSCI ER”), is a composite index of commodity sector returns representing an unleveraged, long-only investment in commodity futures that is broadly diversified across the spectrum of commodities. Like Auspice Diversified, it provides exposure to a number of commodities. There are significant differences however. Importantly, the GSCI index is passive, concentrated in energy, and 100% commodities. Auspice Diversified Trust is active long and short, diversified equally across seven sectors, and also trades financial futures. Reference to the GSCI benchmark does not imply that Auspice Diversified Trust will achieve similar performance.
The S&P/TSX 60 (“TSX 60”) Index is a stock market index of 60 large companies listed on the Toronto Stock Exchange. Maintained by the Canadian S&P Index Committee, a unit of Standard & Poor’s, it exposes the investor to 60 stocks in nine industry sectors. There is a low degree of similarity between the TSX 60 and Auspice Diversified Trust. As the main benchmark for equity performance in Canada its inclusion is typically used to illustrate how Auspice Diversified Trust is notably different from equities, an important consideration for portfolio managers and investors alike. The S&P 500 is an index of 500 stocks chosen for market size, liquidity and industry grouping, among other factors.
The S&P 500 is designed to be a leading indicator of U.S. equities and is meant to reflect the risk/return characteristics of the large cap universe. Price Return data is used (not including dividends). There is a low degree of similarity between the S&P 500 and Auspice Diversified Trust. As the main benchmark for equity performance in the US its inclusion is typically used to illustrate how Auspice Diversified Trust is notably different from US equities, an important consideration for portfolio managers and investors alike.
The Bloomberg Barclay Aggregate Bond Index (BB AGG), is a broad base, market capitalization-weighted bond market index representing intermediate term investment grade bonds traded in the United States.
IMPORTANT DISCLAIMERS AND NOTES
Futures trading is speculative and is not suitable for all customers. Past results are not necessarily indicative of future results. This document is for information purposes only and should not be construed as an offer, recommendation or solicitation to conclude a transaction and should not be treated as giving investment advice. Auspice Capital Advisors Ltd. makes no representation or warranty relating to any information herein, which is derived from independent sources. No securities regulatory authority has expressed an opinion about the securities offered herein and it is an offence to claim otherwise. Please read the offering documents before investing.
Certain statements in this document are forward- looking statements, including those identified by the expressions “anticipate”, “believe”, “plan”, “estimate”, “expect”, “intend”, “target”, “seek”, “will” and similar expressions to the extent they relate to the Fund and the Manager. Forward- looking statements are not historical facts but reflect the current expectations of the Fund and the Manager regarding future results or events. Such forward-looking statements reflect the Fund’s and the Manager’s current beliefs and are based on information currently available to them. Forward-looking statements are made with assumptions and involve significant risks and uncertainties. Although the forward-looking statements contained in this document are based upon assumptions that the Fund and the Manager believe to be reasonable, none of the Fund or the Manager can assure investors that actual results will be consistent with these forward-looking statements. As a result, readers are cautioned not to place undue reliance on these statements as a number of factors could cause actual results or events to differ materially from current expectations.
The forward-looking statements contained herein were prepared for the purpose of providing prospective investors with general educational background information about the Funds and may not be appropriate for other purposes. None of the Fund or the Manager assumes any obligation to update or revise them to reflect new events or circumstances, except as required by law.
This blog may contain hypertext links to web sites owned and controlled by other parties than Auspice. We have no control over any third-party-owned web sites or content referred to, accessed by or available on this web site and therefore we do not endorse, sponsor, recommend or otherwise accept any responsibility for such third-party web sites or content or for the availability of such web sites. In particular, we do not accept any liability arising out of any allegation that any third-party-owned content (whether published on this or any other web site) infringes the intellectual property rights of any person, or any liability arising out of any information or opinion contained on such third-party web site or content.
The contents on this website are provided for informational and educational purposes and are not intended to provide specific individual advice including, without limitation, investment, financial, legal, accounting and tax. Please consult with your own professional advisor on your particular circumstances.
References
[i] https://www.spglobal.com/spdji/en/documents/indexnews/announcements/20221110-1457679/1457679_spgsci2023cpwindexannouncement.pdf