
Executive Summary – “Two For One.”
Unlock diversification without sacrificing your core holdings.
Return stacking is a modern evolution of portable alpha, a strategy historically used by large institutions that is now accessible to all investors. By combining traditional market exposure with a second, uncorrelated return stream, return stacking offers a more capital-efficient way to improve portfolio outcomes without reducing core holdings.
Unlike traditional asset allocation, which divides capital across asset classes, return stacking overlays exposures. This allows investors to maintain full participation in equities or bonds while adding complementary strategies such as CTAs. The result is improved diversification and the potential for stronger long-term, risk-adjusted returns.
The concept is well established, even if the terminology is new. PIMCO StocksPLUS launched in 1993, and the Millburn Catalyst Fund launched in 1996: both are long-term examples of the strategy in action.
Implementation matters. Key risks to manage include:
Asset Class Risk - the potential for unintended equity overexposure
Style Risk - overreliance on convergent strategies (e.g., carry, mean reversion) or other fundamental strategies that may break down in equity market crises.
It is also essential to evaluate conditional correlations. Average correlations may appear attractive, but true diversification is only revealed during periods of stress.
Historically, alternative strategies were often relegated to a hedge fund or diversifier sleeve. Return stacking shifts that paradigm. These strategies can now sit inside the core of a portfolio, functioning as equity or bond replacements, similar to a 130/30 equity fund but with a more diversified return profile.
The volatility of 2025, including the “Trump Tariff Tantrum,” underscored both the potential and limitations of return stacking. A sharp selloff followed by a historic reversal in financial and commodity markets created extreme whipsaws that caught many trend-following[i] strategies offside. This period highlighted that return stacking is not immune to short-term setbacks. Over complete market cycles, however, it remains a compelling improvement to portfolio construction.
Return stacking is not a hedge, nor a panacea – it is a practical and powerful evolution in portfolio design. For investors seeking greater cash efficiency, broader diversification, and stronger alignment with institutional best practices, return stacking offers a practical and powerful solution.
Download Your Copy

[i] Authors Note: “Managed Futures” is an asset class, “Trend-Following” a strategy, and “CTA” (Commodity Trading Advisor) a registration. A large majority of AUM in Managed Futures is in Trend-Following strategies. For the purpose of this paper, we will refer to CTAs or “Trend-Following CTAs”. See more on this here.
Introduction - Portable Alpha vs Return Stacking
“Return stacking” is a relatively new term in public markets, but the concept is built on the foundation of “portable alpha”. For decades, large sovereign wealth plans, pensions, and endowments have used notionally[ii] funded managed accounts to add portable alpha on top of traditional beta exposure.
Some differentiate portable alpha and return stacking based on implementation. Portable alpha typically refers to custom institutional structures using derivatives and managed accounts, while return stacking involves commingled funds that are available to a broad range of investors. Both approaches, however, share the same underlying goal: combining multiple sources of return in a capital-efficient way that preserves core market exposure.
In this paper, the terms are used interchangeably. Table 1 outlines the subtle differences.
Whether implemented through institutional managed accounts or public funds, return stacking and portable alpha represent a meaningful shift in how modern portfolios can be constructed.
Table 1: Return Stacking vs Portable Alpha:
| Feature | Return Stacking | Portable Alpha |
|---|---|---|
| Objective | Increase returns by adding uncorrelated factors on top (in addition) of market beta | Generate targeted alpha on top (in addition) of market beta |
| Structuring | Commingled funds | Notionally funded managed accounts |
| Common Example | 70 to 100% equity allocation (ETF or Futures) + 100% CTA allocation | 100% equity futures + 100% hedge fund, CTA, and/or private market allocation |
| Key Benefit | Simple access to institutional style, cash efficient portfolio structuring | Custom alpha portfolio exposure on top of market beta |
[ii] A notionally funded account is an investment structure that uses derivatives to achieve full market exposure without requiring the full amount of cash upfront, enabling the remaining capital to be deployed in other investment strategies.
Traditional Asset Allocation vs Portable Alpha & Return Stacking.
Traditional portfolio construction relies on fixed capital allocation among asset classes, meaning each dollar invested in one asset class is unavailable for another. This creates a constraint. Allocating to alternatives usually means reducing exposure to equities or bonds.
A standard 60/40 portfolio (60% equities, 40% bonds) has long been the benchmark for balancing growth and risk. A more modern 50/30/20 allocation (with 20% allocated to alternatives) aims to improve diversification, but at the cost of reducing traditional asset exposure.
Return stacking takes a different approach. Instead of reallocating capital between asset classes, it allows investors to overlay additional return sources on top of existing beta allocations. This means:
The investor retains full exposure to equities and bonds.
Additional strategies (e.g., CTAs, other alternatives) are layered on top, enhancing diversification without reducing core holdings.
The goal is capital efficiency – to access multiple sources of return without sacrificing existing portfolio exposure. In essence, return stacking changes the construction process by allowing access to additional return drivers without having to reduce traditional asset exposure. For example, in a “modern” 50/30/20 portfolio an investor must sacrifice 10% of their portfolio that’s in equities, and 10% that’s in bonds, to have a 20% allocation to alternatives. In a return stacking portfolio, the investor retains full 60/40 equity and bond exposure with additional alternative strategies layered on top, “60/40/20”. See Table 2 below.
Table 2: Evolution of Portfolio Construction:

Portable Alpha – Institutional Managed Accounts
“We found we could get our S&P 500 exposure for just a few basis points through a future or swap that required little capital. We decided to add value by buying hedge funds to stack on top of the index. Our process was to do a long-short swap out of the bonds into cash to buy the hedge funds and use the hedge funds as collateral for the S&P 500 Index exposure. That’s the genesis of our portable alpha program.”
Since the 1980s, leading pension funds and endowments have implemented portable alpha to improve capital efficiency and diversification. These institutions used notionally funded accounts to preserve market beta while deploying capital into hedge funds, fixed income, or other alpha-generating strategies. Notable early adopters include:
Ontario Teachers' Pension Plan (OTPP) – One of the pioneering large-scale adopters, OTPP began separating alpha and beta exposures around 1995. It used swaps and futures to synthetically hedge beta, while allocating the alpha portion to diverse active strategies (e.g., long-short equity, GTAA, hedge funds)[1].
Pennsylvania State Employees’ Retirement System (PSERS) – A US$25 billion public pension fund, PSERS was one of the first public pension plans to get into portable alpha in 2002[2].
Massachusetts Pension Reserves Investment Management (PRIM) - PRIM funded its portable alpha program in September 2006, with three fund of-hedge-funds managers and one beta overlay manager, allocating 5% of PRIM’s US $53 billion in total assets. For beta exposure, PRIM used a hybrid approach of about 85% swaps and 15% futures for its S&P 500 overlay[3].
Some of the most notable airline pension turnarounds, including those at Air Canada[4] (managed by Trans Canada Capital) and Delta Airlines[5], attribute much of their success to portable alpha. Both airline pension plans were significantly underfunded following the Global Financial Crisis, and the implementation of portable alpha was a key driver in improved funding rates in the years following.
Today, institutions like the Canada Pension Plan Investment Board (CPPIB), Texas Teachers Retirement System (TRS), and the Florida State Board of Administration (SBA) are among the largest users of this approach
Portable Alpha – Traditional Implementation
Institutional investors have historically implemented portable alpha using derivatives and separately managed accounts (SMAs). Per Table 3 (refer to next page), the typical process includes:
Select a core beta exposure (e.g., S&P 500, MSCI World, or Fixed Income Index).
Gain 100% of such core beta exposure via futures or swaps (keeping capital available for other investments) that only require a small percentage of the notional in margin.
Invest the excess cash into alpha generating strategies (e.g., hedge funds, CTAs, risk-premia, and/or private market strategies).
Table 3: Portable Alpha Implementation:
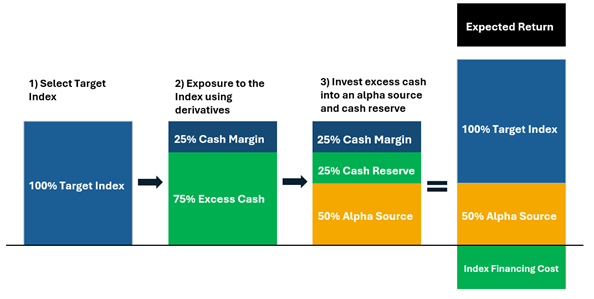
This implementation allows investors to maintain full market exposure while adding additional return sources without requiring additional capital. While this institutional model is highly efficient, it requires advanced portfolio infrastructure, derivatives expertise, and extensive risk oversight - factors that historically excluded many investors from using portable alpha.
Futures vs Funds – S&P 500 Case Study
A key consideration in portable alpha and return stacking implementation is how to gain core beta exposure efficiently. Using the S&P 500 as an example, broadly there are three methods available, each with trade-offs related to capital efficiency, cash management, and dividend treatment.
Table 4: Comparing Implementation Methods:
| Approach | Capital Efficiency | Yield |
|---|---|---|
| Direct Stock or ETF Ownership | Low – full capital required, no capital freed | Dividend Yield |
| Margined Direct Stock or ETF Ownership | Moderate – 50% minimum standard requirement for margin | 50/50 Dividend/Cash Yield |
| S&P 500 Futures | High – typically 5-15% margin, remainder deployable | Cash Yield |
ETFs like SPY or IVV offer easy and cost-effective index access and are more operationally efficient than managing 500 individual stocks. However, they still require high capital commitment.
Key takeaways:
Futures are the most capital-efficient method for obtaining beta exposure. With as little as 7% margin requirement, the remainder of capital is available for additional strategies.
ETFs and direct stock ownership require high capital commitment and do not allow for return stacking unless combined with leverage or futures-based strategies.
In higher-rate environments, interest earned on cash collateral can offset the absence of dividends in futures-based implementations.
The return on collateral can meaningfully affect performance. Managers must be deliberate in how that capital is allocated.
There are further tax implications, however these can vary across jurisdictions and structures.
For return stacking, futures are typically preferred. They allow investors to maintain full market exposure and liquidity while simultaneously adding a second, uncorrelated strategy – achieving the desired capital efficiency at the heart of the portable alpha framework.
Return Stacking – Commingled Funds for All Investors
One of the earliest adopters of return stacking in public markets was PIMCO, who introduced the strategy to institutional investors in the 1980s[6]. The firm later launched PIMCO StocksPLUS in 1993, one of the first public funds to offer return stacking exposure. Since inception, PIMCO StocksPLUS has delivered a 10.67% annualized net return[7], outperforming the S&P 500 Price (ticker “SPX”) and Total Return (ticker “SPXT”) indexes, neither of which include fees or expenses.
Table 6: PIMCO StocksPLUS (PSTKX) Since May 13th, 1993, Inception vs the S&P 500:
| Portfolio 05/13/1993 - 05/31/2025 |
Ann. Return |
Volatility | Sharpe | Sortino | Max Drawdown |
Skew |
|---|---|---|---|---|---|---|
| PSTKX | 10.67% | 15.87% | 0.79 | 1.18 | -56.78% | -0.70 |
| SPX Index | 8.45% | 14.91% | 0.67 | 0.99 | -52.56% | -0.59 |
| SPXT Index | 10.54% | 14.92% | 0.81 | 1.23 | -50.96% | -0.59 |
PSTKX incorporates shorter/intermediate duration bonds in lieu of short term treasuries, a stacking of a small risk premium. PIMCO launched the PIMCO StocksPLUS long duration fund (PSLDX) August 31st, 2007, stacking a larger risk premium on top of equities. The outperformance is significant. While volatility is higher, the net returns outpace the gross return of the S&P500 Total Return (SPXT) by over 2% annualized with the same maximum drawdown. See Table 7:
Table 7: PIMCO StocksPLUS (PSLDX) Since August 31st, 2007, Inception vs the S&P 500:
| Portfolio 08/31/2007 - 05/31/2025 |
Ann. Return |
Volatility | Sharpe | Sortino | Max Drawdown |
Skew |
|---|---|---|---|---|---|---|
| PSLDX | 12.38% | 21.22% | 0.72 | 1.08 | -50.96% | -0.58 |
| SPX Index | 8.21% | 15.79% | 0.62 | 0.92 | -52.56% | -0.58 |
| SPXT Index | 10.34% | 15.79% | 0.76 | 1.14 | -50.95% | -0.58 |
CTAs in the US
In the US, Commodity Trading Advisor (CTA) Millburn, and CTA focused Fund-of-Funds Abbey, expanded on this approach with CTA-driven solutions, accumulating approximately US $10 billion between their respective funds. New entrants, such as the Return Stacked ETFs by ReSolve/Newfound, and more recently AQR and Winton in 2025, further highlight the growing adoption of this methodology. The following are some of the established return stacking fund managers in the US:
Catalyst/Millburn Hedge Strategy Fund
Abbey Capital Multi Asset Fund
Standpoint Multi Asset Fund
Return Stacked (ReSolve / Newfound Research)
AQR Fusion Funds
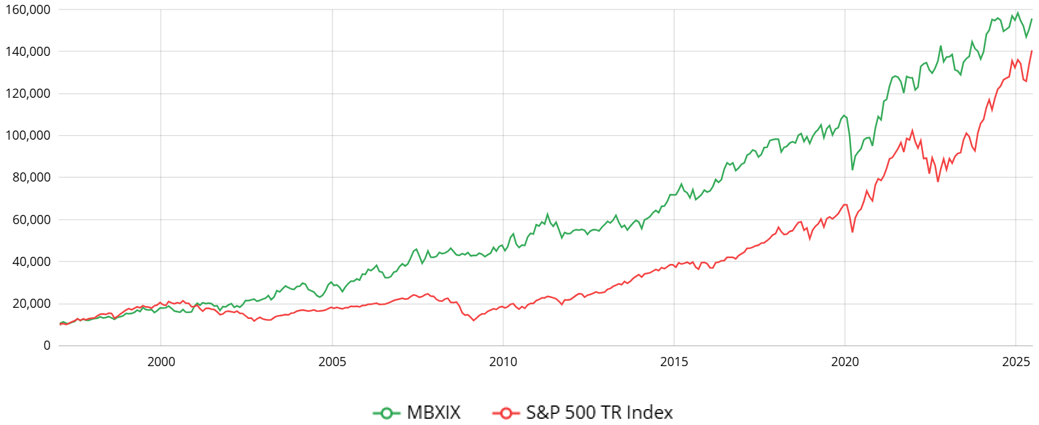
The Millburn Catalyst Fund, CTA-Led Return Stacking.
The Millburn Catalyst Fund is the original pioneer in the return-stacking space, with the I Class (ticker “MBXIX”) launched on a December 31st, 1996. The Fund overlays a systematic CTA strategy on top of equity exposure, providing both diversification benefits and risk mitigation. The outperformance in Chart 1 is apparent, however there are key considerations to highlight:
In 2001, 2008, and 2022 there was significant outperformance versus the S&P 500.
In Q1 2020, there was underperformance, however the fund outperformed Q2-Q4.
In H1 2025, there was underperformance, similar to Q1 2020.
While the improvement versus S&P 500 beta is significant, it should be noted that it is not a “perfect” solution, with pullbacks in both 2020 and recently in 2025, both shallower than the S&P 500[iii].
Chart 1: Millburn Catalyst (MBXIX) vs the S&P 500 (S&P 500 TR Index):
Other Cash Efficient Funds:
Beyond the previously mentioned US-based funds, there are an increasing number of other US-based cash efficient strategies, including:
Strategy Shares Gold Enhanced Yield ETF
WisdomTree U.S. Efficient Core Fund
Simplify US Equity PLUS Convexity ETF
[iii] For year-to-date period as of June 30th 2025, the S&P500TR pulled back 18.75% vs 15.59% for MBXIX. In 2020, the S&P500TR pulled back 33.79% versus 31.73% for MBXIX.
Return Stacking – benefits, tradeoffs
Return stacking is particularly valuable in environments where traditional asset classes face headwinds such as inflation, volatility, or low real yields. By layering uncorrelated or negatively correlated strategies like CTAs on top of traditional market exposure, return stacking enables investors to build more resilient portfolios without sacrificing growth. The key benefits include:
Improved Risk-Adjusted Returns and Absolute Returns.
Historically, adding diversifying strategies often improved risk-adjusted returns (better Sharpe) but often came at the cost of lower absolute returns. This gave rise to the critique that "you can't eat Sharpe” - return stacking helps solve this problem. By overlaying uncorrelated return streams on top of core beta exposures, return stacking has the potential to enhance both risk-adjusted and absolute returns. For example, CTAs have historically delivered positive returns during equity drawdowns, helping to smooth overall portfolio performance. Unlike traditional diversification approaches that dilute equity exposure, return stacking allows investors to retain full market participation while adding complementary strategies.
Behavioral Advantages: Overcoming Line-Item Risk
Many investors analyze their portfolios line by line and may abandon diversifiers during temporary underperformance. Return stacking reduces this risk. Because the investor’s core equity exposure remains intact, there is less temptation to exit the diversifying strategy in isolation. This can lead to greater investment discipline and more consistent long-term outcomes.
Capital Efficiency – No Diversification Trade-Off
Traditional asset allocation requires reallocating capital to make room for alternatives, often at the expense of core holdings. Return stacking removes this constraint. Investors can maintain their original equity or bond exposure while layering a second return stream using capital-efficient instruments like futures. This approach is especially useful in allocation-constrained portfolios or situations where reducing equity exposure is undesirable.
Navigating the Performance-Diversification Spectrum
While return stacking improves upon many traditional diversification techniques, it is important to understand the “trade-off” involved. Consider Table 8:
Table 8: Performance-Diversification Spectrum:
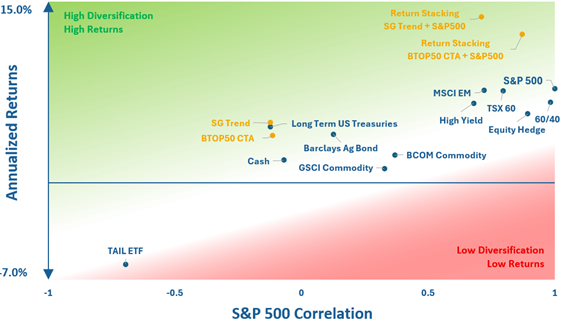
For liquid public market strategies[iv], there tends to be a trade-off between diversification and returns. As a strategy approaches zero equity correlation and becomes negative, returns and risk-adjust returns generally become lower. Most strategies fall within the white spectrum – strong diversification can come at the cost of performance. For example, one would be hard pressed to find a strategy with a 0.5 Sharpe or higher, and an equity correlation between -1.0 and -0.5.
As illustrated in Table 8, return stacking equities plus trend following CTAs moves beyond the spectrum, offering higher returns and built-in diversification.
For investors, portfolio considerations are as follows:
Tail hedge funds historically have delivered strong negative equity correlations but are impractical for most investors due to negative long-term returns. There are multiple live performance CTA indexes with almost 40 years of history – there are no such tail hedge indexes due to a lack of long-term success with tail hedge strategies.
CTA trend following (BTOP50 CTA and SG Trend Indexes) with zero to slight negative equity correlation, has been the largest source of diversification for many institutional investors, often in “Crisis Risk Offset (CRO)” or “Risk-Mitigating Strategies (RMS)” portfolios[8]. The retail uptake, however, has been lesser given returns may be lower than other solutions with higher equity correlation.
Long term US treasuries historically have provided a strong complement to equities, and this is why they historically are the second largest component in CRO and RMS portfolios - albeit they may be less effective in an inflationary environment.
While return stacking involves higher equity correlation than pure CTA strategies, it still offers lower correlation than traditional 60/40 portfolios, along with significantly higher return potential.
[iv] Less liquid private market strategies can provide high returns and low correlation but sacrifice liquidity.
Risk Considerations
“Portable alpha, when implemented responsibly, should not amplify risk exposure but rather enhance diversification and returns”
While return stacking offers compelling potential benefits, investors should carefully consider two primary risks that arise when layering additional exposures on top of an existing portfolio:
Asset Class Risk – Doubling up on equities or growth risk.
Style Risk – Convergent vs. divergent risk-taking.
Asset Class Risk - Doubling Up on Equities or Growth Risk.
One of the biggest challenges in structuring a return stacking portfolio is ensuring true diversification rather than unintentionally increasing exposure to equity or growth risk. For example, some CTAs have significant exposure to equity and financial futures, making them potentially less effective during sharp equity downturns. Other alternative strategies have attractive correlations, but unattractive conditional correlations – for example low equity correlations in benign market periods, but increasing, higher equity correlations in equity stress periods.
Consider the COVID-driven market crash in March 2020. Some financially focused CTA funds struggled alongside equities due to their exposure to financial assets. By contrast, trend-following CTAs with broad commodity exposure performed better, demonstrating the importance of diversification across asset classes. As such, consider the following best practices:
Prioritize CTA and alternative strategies with a history of performance during equity drawdowns (conditional correlations that are zero or negative).
Avoid strategies that are over-reliant on equities (such as long-short equities) or mean-reverting growth related factors, as they tend to break down during equity crises events.
It is also important to remember that a strategy with a slight negative equity correlation, while highly diversifying, is much different from a direct, typically costly hedge with a -1.0 equity correlation. Trend following, for example, tends to do very well in equity market selloffs, as emotional and liquidity driven trading typically creates momentum across markets.
There is a difference in trend following and buying puts on equity indices, however. See Practical Implications for more on this
Convergent vs. Divergent Risk Taking
“Convergent risk tasking strategies are characterized by many small gains but also occasional devastating losses. These strategies are generally based on market fundamentals and the human tendency for logical sense. The returns look a lot like the equity markets. Convergent strategies are comfortable for people because many small gains feed the human need for constant gratification (ex. Yield, making returns every month, quarter, year). Most traditional and alternative asset are convergent.”
Many alternative strategies provide diversification in benign markets but then fail in extended equity sell offs. These strategies exhibit “convergent” risks, which can fail in market stress events. Consider the comparison in Table 9.
Table 9: Convergent Versus Divergent Risk Taking:
| Type | Characteristics | Common Examples | Performance During Crisis |
|---|---|---|---|
| Convergent Strategies | Frequent small gains, occasional large losses | Carry trades, Mean Reversion, Long/Short Equity | Tend to suffer in market crises |
| Divergent Strategies | Frequent small losses, occasional large gains | Trend-Following CTAs, Tail Risk Hedging, some Macro Strategies | Often perform well in crises |
Most traditional and alternative assets are convergent. Return stacking strategies that include divergent strategies, those that benefit from market dislocations (Trend-Following CTAs, Tail Risk, Macro), may be the best complement.
Types of Leverage & Leverage Risks
Return stacking relies on capital-efficient instruments such as futures to overlay additional strategies on top of core market exposures. This naturally involves some form of leverage. However, not all leverage is created equal, and understanding the purpose and type of leverage used is critical for risk management. See Tables 10 (below) and 11.
Table 10: Purpose of Leverage:
| Leverage Type | Description | Example | Typical Use Case |
|---|---|---|---|
| Risk Additive | Increases exposure to the same asset or risk factor, magnifying both gains and losses | 2x Leveraged ETFs | Speculative or short-term tactical trading |
| Risk Neutral | Adds exposure to uncorrelated assets, maintaining total portfolio risk | Risk Parity Strategies | Balancing risk across the portfolios |
| Risk Reducing | Adds negatively correlated return streams, improving diversification and reducing downside risk | CTA overlay on equities | Return stacking or crisis risk offset |
Risk can be measured in a number of ways, but ultimately “drawdown” or “maximum drawdown” tends to be of greater importance to investors. The goal of return stacking is not to amplify risk (“risk additive” risk), but to use risk neutral or risk reducing leverage to improve portfolio robustness. This is typically accomplished through derivatives such as futures or swaps, which allow investors to attain notional exposure with a fraction of capital committed.
Derivatives-based leverage is preferred in portable alpha and return stacking frameworks because it is scalable, transparent, and efficient. Unlike financial borrowing or embedded leverage, futures require margin rather than full capital (i.e., the full notational exposure), allowing the remainder of the portfolio to be allocated elsewhere. See Table 11.
Table 11: Types of Leverage:
| Type of Leverage | How it Works | Use In Return Stacking |
|---|---|---|
| Financial Leverage (Borrowing) | Investors borrow capital to expand investment size | Typically avoided in return stacking due to financing costs |
| Derivatives-Based Leverage | Options, futures, and swaps provide synthetic exposure without direct capital allocation | Used in most portable alpha implementations |
| Embedded leverage (leveraged ETFs & Structured Products) | Built into fund structures via derivatives | Less flexible, higher fees |
| Portfolio Margining | Prime brokers offer financing for large funds | Available only to institutions |
Practical Implications
Leverage should be evaluated not just by how much is used, but how it is used. A return stacking portfolio that layers a diversifying strategy like trend-following on top of equities may result in lower drawdowns and higher Sharpe ratios, even though gross notional exposure is elevated.
Understanding these distinctions helps avoid misleading conclusions about portfolio risk. Not all leverage increases volatility, and in the case of return stacking, it may actually reduce overall portfolio risk by introducing low or negatively correlated return streams.
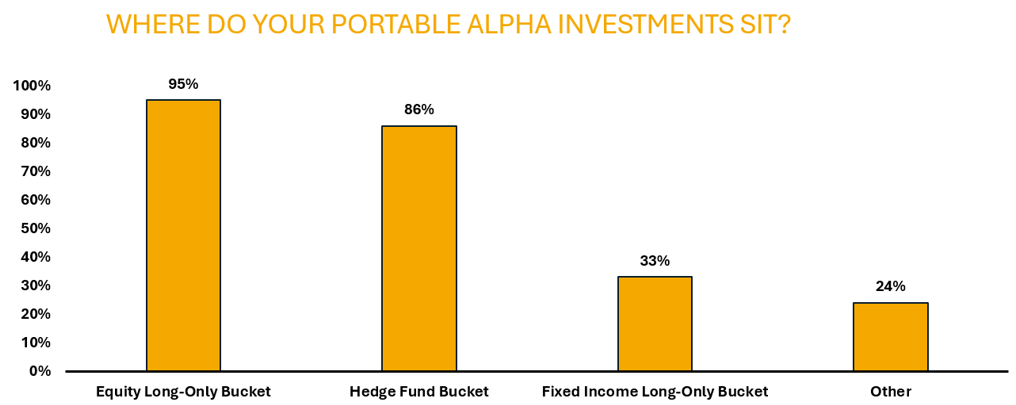
Where to Allocate – Within Equities or Hedge Funds?
Traditionally, liquid alternatives such as CTAs have been allocated to an “alternative”, “hedge fund”, or “diversifying strategies” bucket in a portfolio. However, for return stacking strategies that maintain 75% to 100% equity exposure, these products can serve as an equity replacement rather than an alternative diversifier. This makes return stacking particularly useful for investors seeking diversification without sacrificing equity participation.
Chart 2: BNP Paribas 2025 Hedge Fund Outlook, Portable Alpha Survey:
Practical Limitations – An Improvement, Not Perfection.
While return stacking poses a significant improvement over traditional diversification methods, no strategy is flawless. Even the most thoughtfully constructed portfolios can experience setbacks under unusual market conditions.
Consider the “Trump Tariff Tantrum” of 2025, which disrupted both financial and commodity markets. Historically, trend-following strategies have provided strong offsetting performance during major equity drawdowns. In 2025, however, many trend-following CTAs experienced losses, albeit limited. This was not due to structural failure, but rather the rare combination of extreme choppy volatility without persistent trends. For example, the S&P 500 sold off sharply, then rallied over 12% in a single day. Many trend-followers who had turned short were caught in the reversal. Similar whipsaws occurred in several commodity and currency markets. These events were atypical, but they highlight an important reality: trend following, while highly diversifying, is not a perfect hedge and carries risk.
Understanding Probabilistic Tools
Investors sometimes expect diversifying strategies to offset risk in every market correction. In reality, these tools are probabilistic, not deterministic. A weather forecast that calls for a 90% chance of sunshine does not imply certainty. If it rains, the forecast is still accurate within the probability range. The same principle applies to return stacking.
Trend-following CTAs have historically performed well during major equity drawdowns. However, this has not occurred in every instance. Table 12 (refer to next page) illustrates the BTOP50 CTA Index performance during the 15 worst quarters for the S&P 500 since 1987. Two points stand out:
Neither Q1 nor Q2 of 2025 appear in the list. Although market volatility was significant, the S&P 500 ultimately ended the first half of the 2025 year with a positive return.
On average, trend-following CTAs provided more than 20% of outperformance compared to the S&P 500 during those 15 quarters.
Table 12: BTOP50 CTA Performance During the 15 Worst Quarters:
| Quarter | Event | S&P 500 | BTOP50 CTA | Difference |
|---|---|---|---|---|
| 4Q 1987 | Black Monday - Global Stock Market Crash | -23.23% | 16.88% | 40.11% |
| 4Q 2008 | Global Financial Crisis Led By Financials | -22.56% | 9.14% | 31.70% |
| 1Q 2020 | COVID-19 Breakout | -20.00% | -2.24% | 17.76% |
| 3Q 2002 | WorldCom Scandal | -17.63% | 9.41% | 27.04% |
| 2Q 2022 | Russia/Ukraine War, Inflation Surge | -16.45% | 6.66% | 23.11% |
| 3Q 2001 | 9/11 Terrorist Attacks | -14.99% | 4.92% | 19.11% |
| 3Q 1990 | Iraq Invades Kuwait | -14.52% | 11.22% | 25.74% |
| 3Q 2011 | European Sovereign Debt Crisis | -14.52% | 1.43% | 15.96% |
| 4Q 2018 | Global Growth Slowdown | -13.97% | -2.05% | 11.92% |
| 2Q 2002 | Aftermath of Tech Bubble | -13.67% | 8.52% | 22.19% |
| 1Q 2001 | Bear Market in Equities Led By Tech | -12.11% | 5.97% | 18.08% |
| 2Q 2010 | Sovereign Debt Crisis | -11.86% | -1.94% | 9.92% |
| 1Q 2009 | Global Financial Crisis Led By Financials | -11.67% | -1.75% | 9.92% |
| 3Q 1998 | Russia Debt Default & LTCM Crisis | -10.30% | 10.78% | 21.08% |
| 1Q 2008 | Credit Crisis, Commodity Prices Rally | -9.92% | 6.43% | 16.35% |
| Average | -15.15% | 5.50% | 20.65% | |
The Importance of a Long-Term Perspective.
Return stacking is most effective when viewed over complete market cycles. As with any diversifying strategy, periods of underperformance are inevitable in the short term. For patient investors who understand the probabilistic nature of these strategies, such moments may represent attractive entry points.
The Auspice One Fund.
Auspice has a long history of working with institutional investors to implement portable alpha strategies through managed accounts and notional funding. These structures allow investors to cover only the required margin rather than the full notional exposure, improving capital efficiency and enabling multiple return streams within a single allocation.
In 2023, after nearly two years of work with Canadian regulators, Auspice received the first-ever exemption under NI 81-102 to use derivatives within a Value-at-Risk (VaR) framework. This regulatory evolution allowed for the creation of return stacking strategies within a publicly available Canadian liquid alternative mutual fund structure.
As of January 2025, for every dollar invested in the Auspice One Fund Trust, investors receive:
$1 exposure of the S&P 500 beta, and,
$1 exposure of Auspice Diversified, the Auspice flagship CTA strategy.
For more information on the Auspice One Fund and other cash efficient strategies offered by Auspice, contact info@auspicecapital.com.
Conclusion
Return stacking represents a powerful evolution in portfolio construction – a way to enhance diversification, improve risk-adjusted returns, and preserve core equity or fixed income exposures, all within a capital-efficient framework. By building on the institutional foundation of portable alpha and democratizing access through commingled fund structures, investors of all sizes can now incorporate uncorrelated return streams such as CTAs or other alternatives alongside traditional beta exposures.
Effective implementation requires thoughtful strategy selection, awareness of conditional correlations, and an understanding of style risk and leverage types. Investors must be cautious not to unintentionally double up on equity or growth risks or rely on convergent strategies that may falter during periods of market stress.
The 2025 “Trump Tariff Tantrum” highlighted that even trend-following CTAs – typically resilient during drawdowns – can underperform in environments of extreme volatility without trend. Yet, much like weather forecasts, probabilistic tools like return stacking should be judged not on isolated events but on how effectively they stack the odds in the investor’s favor over time.
At Auspice, we have long supported capital-efficient portfolio design, first through institutional managed accounts and now through the Auspice One Fund – a Canadian return stacking solution that provides dual exposure to the S&P 500 and our flagship Auspice Diversified strategy, “two for one”. For long-term investors seeking to improve portfolio resilience and efficiency, return stacking may offer not only diversification, but a smarter way forward. Stay tuned for future updates from Auspice on further return stacking solutions.
Third Party Research
For investors seeking further insights into portable alpha and return stacking, the following research provides additional perspectives from respected institutional sources. These reports offer historical context, recent innovations, and strategic considerations relevant to both traditional and modern implementations of these approaches.
Meketa – Portable Alpha. October 2020
BlackRock – Portable Alpha Strategies. December 2024
Institutional Investor – Portable Alpha Makes a Comeback. January 2025
Man Group – Portable Alpha: Solving the Magnificent Problem. January 2025
AQR – Portable Alpha: Why now? February 2025
Return Stacked - Portable Alpha: Enhancing Portfolio Returns Through Strategy Separation. September 2024
Definitions
The S&P 500 is a market-capitalization-weighted index of approximately 500 of the largest publicly traded U.S. companies, covering around 80% of total U.S. market capitalization. It is widely regarded as a primary benchmark for U.S. large-cap equity performance and economic sentiment. There are a number of variants, including futures-based versions, as described below:
SPX – Price return only. Excludes dividends.
SPXT – Total return. Includes dividend reinvestment.
SPTR500N - Net total return. Includes dividends after assumed withholding tax, often used for global fund benchmarking or European UCITS products.
SPXFP – Futures Excess Return. Price return of rolling futures, excludes dividends and carry.
SPXFTR – Futures Total Return. Futures price return plus collateral return from cash held (e.g., T-bills); reflects a fully collateralized futures exposure.
Barclay BTOP50 Index (BTOP50) - The BTOP50 Index is produced by BarclayHedge and tracks the largest CTA programs, chosen to represent at least 50% of total investable managed futures assets. It is AUM-weighted, reflecting the composition of the industry across trend-following and multi-strategy managers, and serves as a benchmark for institutional managed futures performance.
PSTKX (PIMCO StocksPLUS® Fund – Institutional Class) - PSTKX seeks to outperform the S&P 500 Index by using derivatives (primarily futures and swaps) to replicate S&P 500 exposure, while investing the remaining portfolio in fixed income instruments actively managed by PIMCO. Its strategy aims to deliver equity-like returns with bond income support. PSTKX maintains a shorter-duration fixed‑income sleeve, with an effective duration of about 0.6 years and average bond maturity around 1.4 years as of Q1 2025.
PSLDX similarly targets the S&P 500’s total return through equity derivatives backed by a long-duration fixed income portfolio, typically with duration analysis aligned to the Bloomberg Long-Term Government/Credit Index (~13-year duration). It aims for enhanced returns with interest-rate sensitivity from its bond holdings.
MBXIX (Catalyst/Millburn Hedge Strategy Fund – Class I) - MBXIX employs a 100% systematic, multi-strategy model, combining active long/short positions in futures (spanning currencies, equity indices, interest rates, commodities) with a strategic equity component via passive ETFs or stocks. Its objective is long-term capital appreciation with low equity correlation, designed to deliver smoother returns and crisis resilience.
Disclaimers
IMPORTANT DISCLAIMERS AND NOTES
There is a substantial risk of loss in trading futures and options. Past performance is not necessarily indicative of future results.
Commissions, trailing commissions, management fees and expenses may all be associated with investment funds. Please read the prospectus or applicable offering document before investing. Investment funds are not guaranteed, their values change frequently and past performance may not be repeated.
The hypothetical performance shown is not actual performance. Hypothetical performance has inherent limitations and does not represent actual trading. No representation is being made that any account will or is likely to achieve performance results similar to those shown within this chart. The results are based on simulated or historical data, not actual trading. The hypothetical performance shown does not reflect the deduction of advisory fees, trading commissions or other expenses that would be incurred in an actual account. Other factors, such as market impact, may adversely affect the actual trading results.
The Auspice One Fund Trust aims for every dollar invested, you get $1 of exposure to the flagship protective CTA / managed futures strategy, Auspice Diversified, and $1 of exposure to the S&P 500 though the precise allocation may fluctuate due to market movements and capital flows.
These materials are provided for informational and educational purposes and are not intended to provide specific individual advice including, without limitation, investment, financial, legal, accounting and tax. Please consult with your own professional advisor on your particular circumstances.
Futures trading is speculative and is not suitable for all customers. Past results are not necessarily indicative of future results. This document is for information purposes only and should not be construed as an offer, recommendation or solicitation to conclude a transaction and should not be treated as giving investment advice. Auspice Capital Advisors Ltd. (the “Manager” or “Auspice”) makes no representation or warranty relating to any information herein, which is derived from independent sources. No securities regulatory authority has expressed an opinion about the securities offered herein and it is an offence to claim otherwise. Please read the applicable offering documents before investing.
This material may contain forward-looking statements, which were prepared for the purpose of providing general educational background information and may not be appropriate for other purposes. Certain statements in this document are forward- looking statements, including those identified by the expressions “anticipate”, “believe”, “plan”, “estimate”, “expect”, “intend”, “target”, “seek”, “will” and similar expressions to the extent they relate to an Auspice managed investment fund (the “Fund”), where applicable, and the Manager. Forward- looking statements are not purely historical facts but reflect the current expectations of the Fund, where applicable, and the Manager regarding future results or events. Such forward-looking statements reflect the Fund’s, where applicable, and the Manager’s current, reasonable beliefs and are based on information currently available to them. Forward-looking statements are made with assumptions and involve significant risks and uncertainties.
Although the forward-looking statements contained in this document are based upon assumptions that the Fund, where applicable, and the Manager believe to be reasonable, neither the Fund, where applicable, or the Manager can assure investors that actual results will be consistent with these forward-looking statements. There is no guarantee that any forward-looking statement will come to pass. As a result, readers are cautioned not to place undue reliance on these statements as a number of factors could cause actual results or events to differ materially from current expectations.
Neither the Fund, where applicable, nor the Manager assumes any obligation to update or revise any forward-looking statement to reflect new events or circumstances, except as required by law.
The Manager may present the enclosed information in a white paper – such white paper may contain hypertext links to web sites owned and controlled by parties other than Auspice. We have no control over any third-party-owned web sites or content referred to, accessed by or available on such web site and therefore we do not endorse, sponsor, recommend or otherwise accept any responsibility for such third-party web sites or content or for the availability of such web sites. In particular, we do not accept any liability arising out of any allegation that any third-party-owned content (whether published on this or any other web site) infringes the intellectual property rights of any person, or any liability arising out of any information or opinion contained on such third-party web site or content.
Sources
2https://thehedgefundjournal.com/portable-alpha/
3https://rpc.cfainstitute.org/sites/default/files/-/media/documents/book/rf-publication/2009/rfv2009n3.pdf
4https://pensionpulse.blogspot.com/2019/12/trans-canada-capital-ready-for-take-off.html
5https://www.institutionalinvestor.com/article/2bstmh8ejny137ipgny0w/culture/how-jon-glidden-resurrected-a-forsaken-strategy-and-revived-a-dying-pension
6https://www.cmegroup.com/education/courses/portfolio-management-with-equity-index-futures-and-options/alpha-beta-and-portable-alpha.html
7https://www.pimco.com/us/en/investments/mutual-fund/pimco-stocksplus-fund/inst-usd
8https://static1.squarespace.com/static/53a1ca9ce4b030ded763dbc2/t/6189466ec9b4ef48164168ee/1636386415639/Commodities+%26+CTAs+Case+Study%2C+US+Pensions+%26+Ontario+Teachers%27+-+Auspice.pdf