To download the Auspice September Blog as a PDF, click here.
We were recently approached by an institutional client regarding how commodities and CTA might be utilized within a Total Portfolio Management (TPM) framework. This question is coming up more and more as investors, especially institutional investors, think in terms of total fund objectives and not within asset class silos.
This piece explores where commodities fit in the “total fund” - how they diversify risk factors, enhance liquidity and capital efficiency while combating inflation and stagflation, potentially delivering real benefits at the portfolio level.
Total Portfolio Management (TPM)
At its core, TPM shifts the focus away from traditional asset class labels like “equities” or “real estate.” Instead, it looks through to the fundamental risk and return drivers that cut across all investments. By putting every opportunity - public or private, traditional or alternative - into one joined-up process, capital competes on equal footing.
This approach is more dynamic, less constrained by benchmarks, and better at understanding risk factors. Studies suggest that compared with traditional strategic asset allocation, TPM can add meaningful value by improving decision framing, reducing governance drag, and achieving a more balanced mix of exposures[1].
Unsurprisingly, TPM has become a hallmark of some of the world’s most sophisticated allocators. The “Maple 8” Canadian pensions are frequently cited as pioneers, alongside global peers such as New Zealand Super, Australia’s Future Fund, and Singapore’s GIC, all of which have embraced this “one portfolio” mindset[2].
Within a TPM framework, every investment must “earn its place” by demonstrating clear contributions to return, risk balance, and resilience. Commodities can meet this test exceptionally well and are gaining institutional adoption.
Commodities in the Total Fund
Figure 1: Why Commodities?
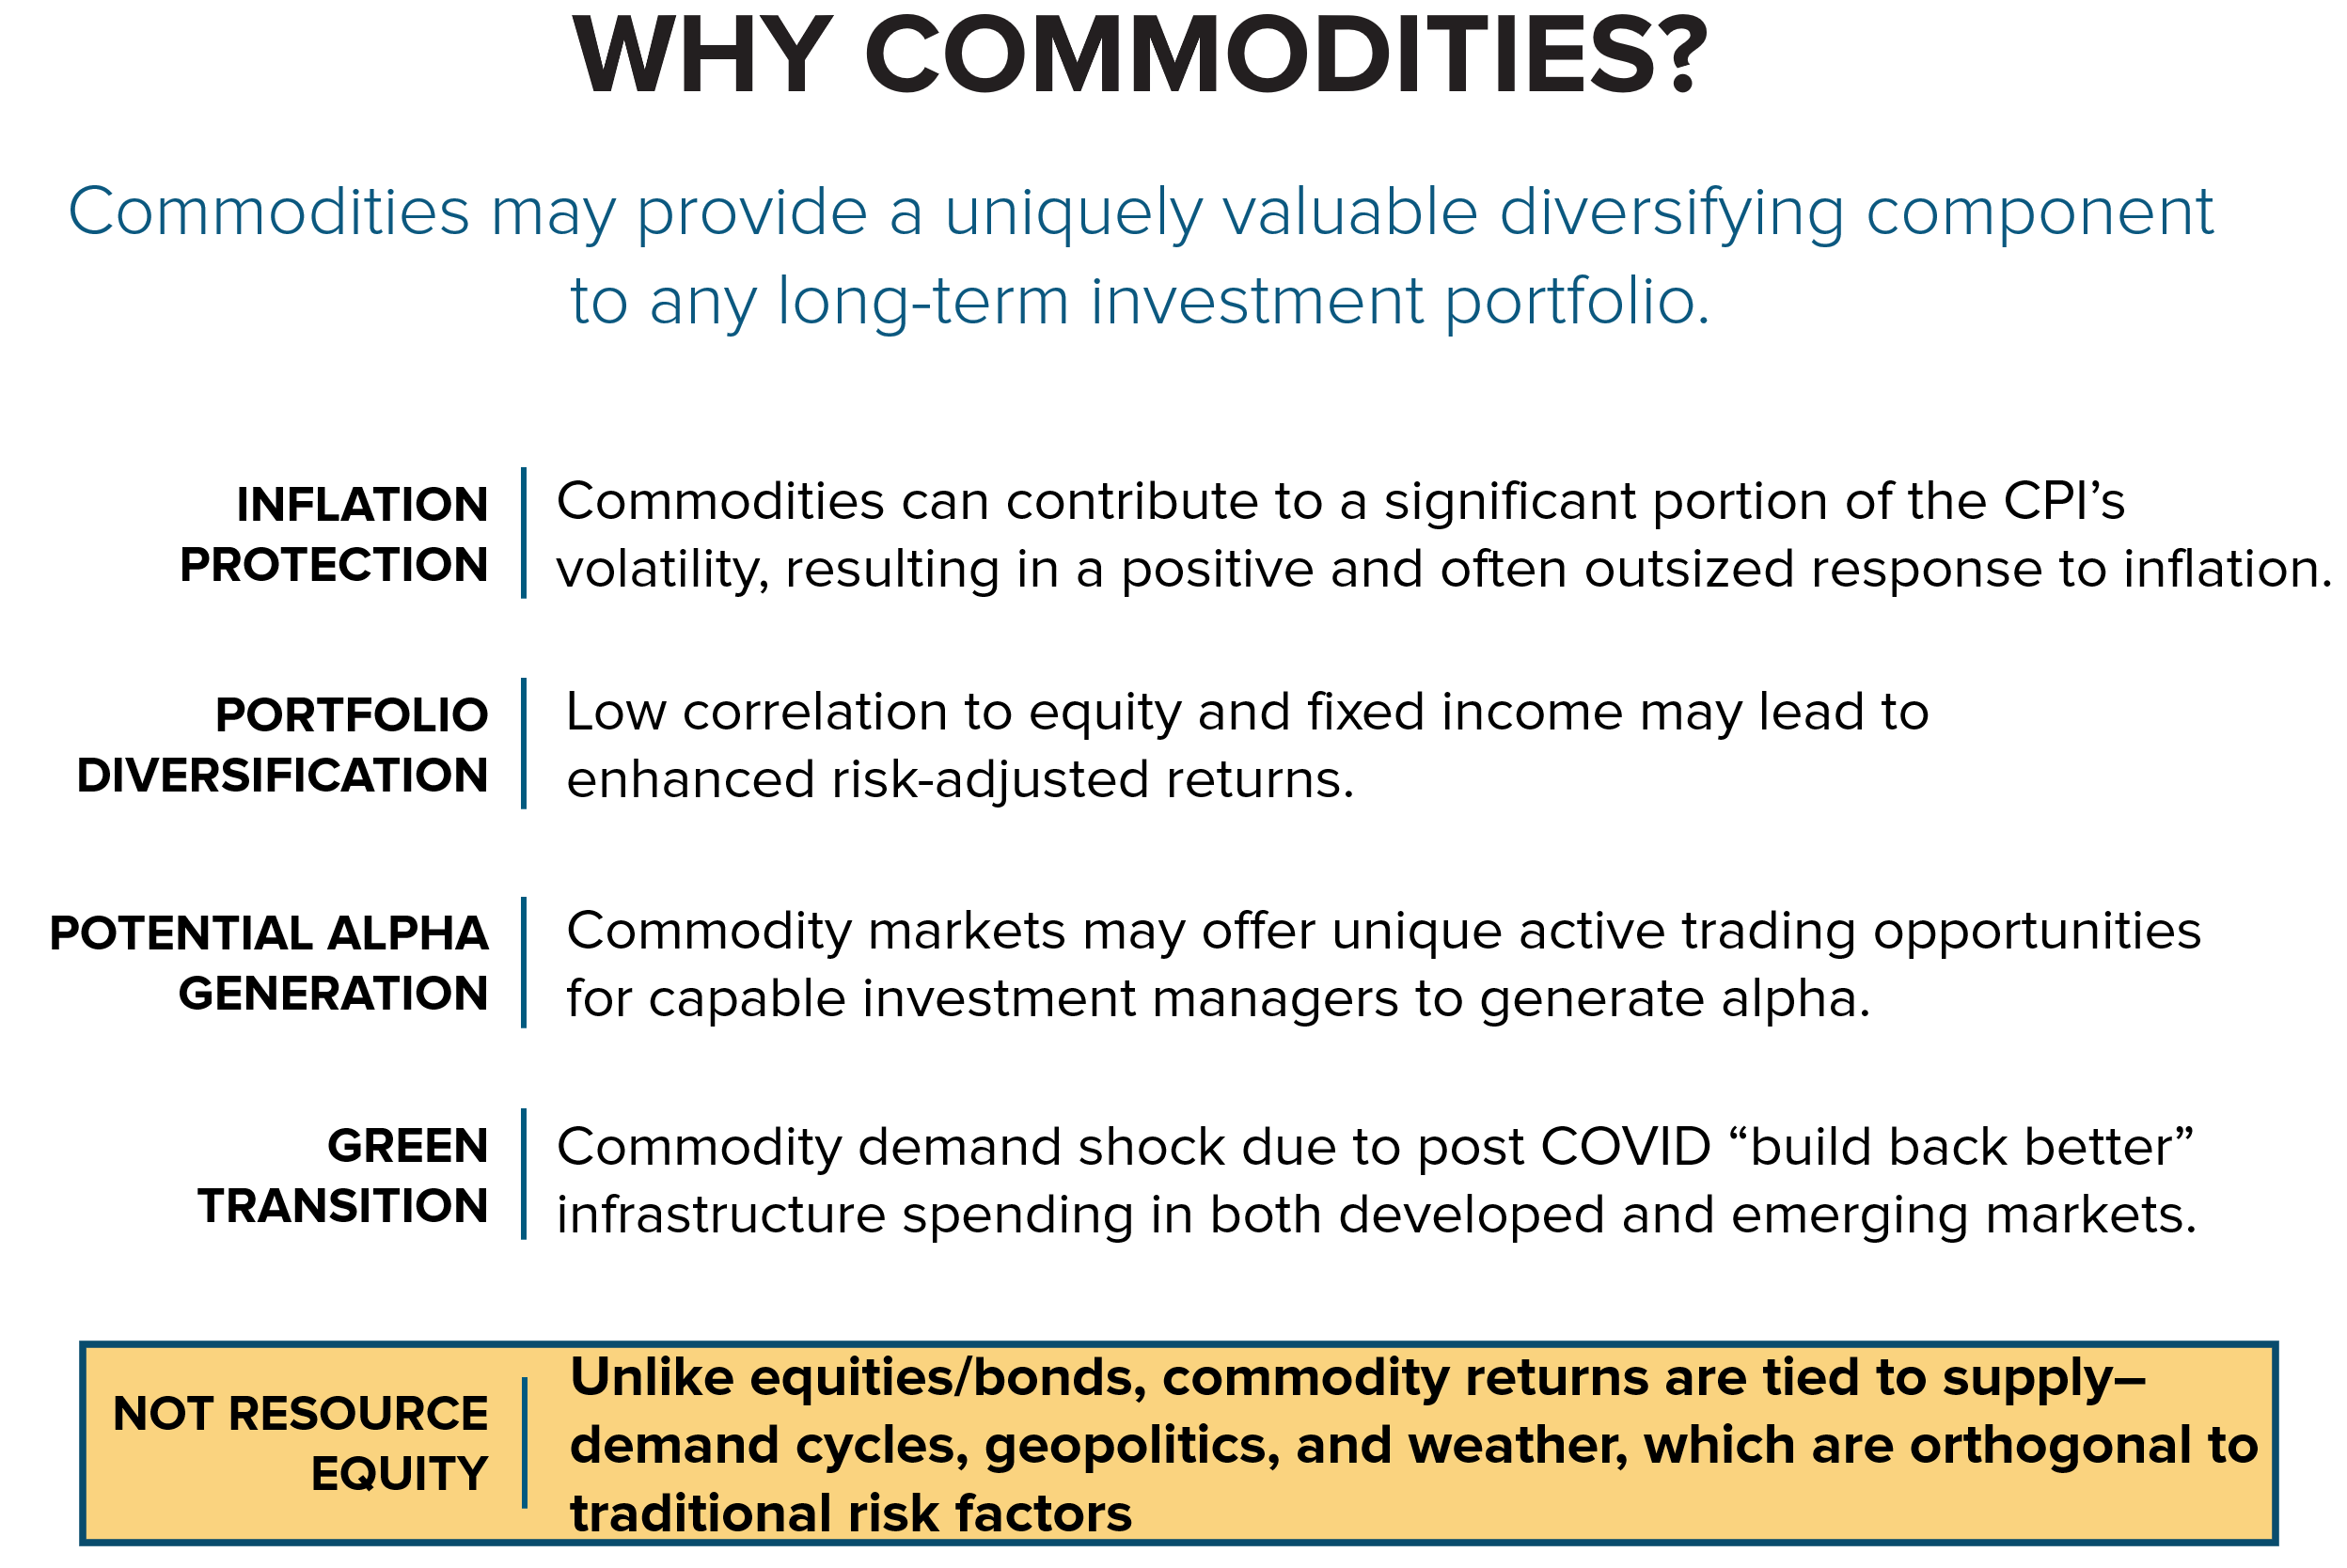
Source: Auspice Capital Advisors
Commodities are not only one of the best ways to guard against inflation, they also tend to move differently than stocks and bonds - giving a portfolio valuable risk factor diversification. On top of that, they create opportunities for skilled managers to generate returns through active trading. Take natural gas as an example: an investor might avoid the volatile front of the futures curve where steep contango creates losses from negative roll yield and instead position further out on the curve. If taking the opposite view, shorting natural gas, the front of the curve might be the better choice. This flexibility makes commodities unique: they can both strengthen the foundation of a portfolio and provide room for tactical (alpha) opportunities.
It is important to highlight the last point in Figure 1: we are not talking about resource equity (or debt). Stocks in commodity producers behave more like other stocks and do little to diversify total portfolio risk. True commodity exposure is linked to one thing: the underlying.
If one considers diversification only from a silo or bucketed perspective, the dollar allocation may appear diversified but is not from a risk perspective. The risk is a concentration of exposures tied to economic growth, which is essentially equity risk. Instead, we encourage investors to think of diversification of risks versus diversification of labels. Consider Figure 2 below:
Figure 2: Dollar Allocation Versus Risk Allocation
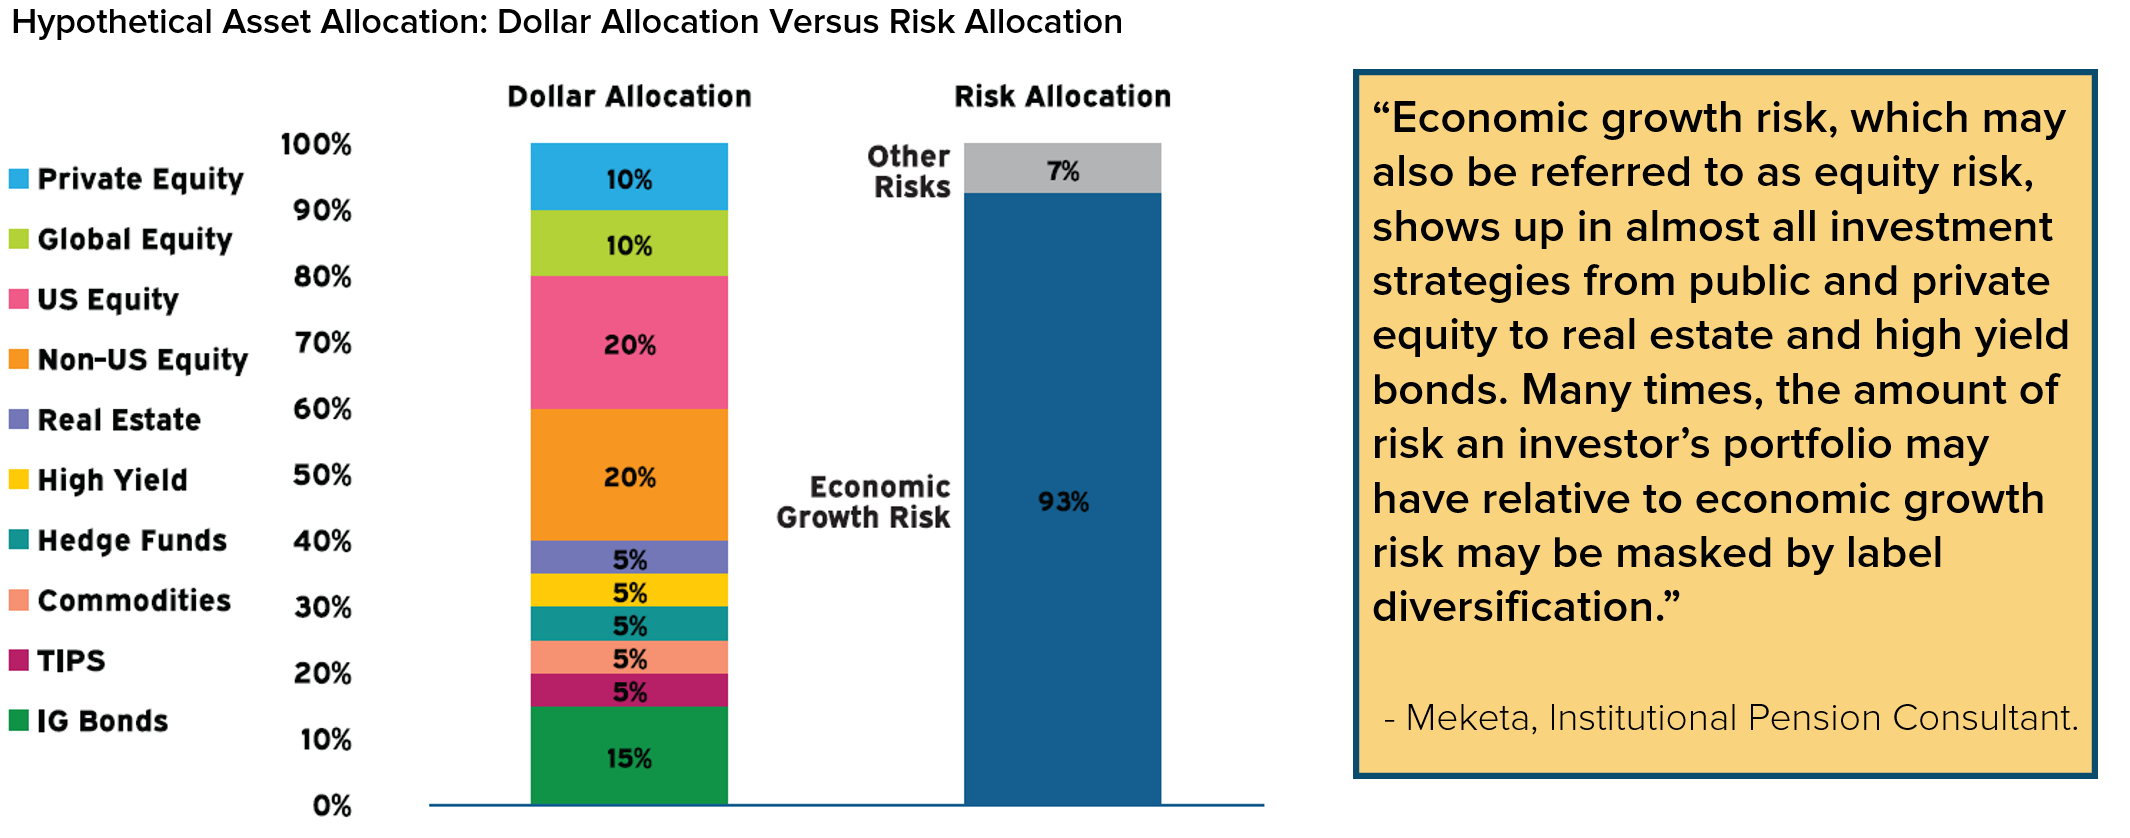
Source: https://meketa.com/leadership/risk-mitigating-strategies/, March 2023
Risk Factors
Within the TPM framework, we look at commodities in terms of the exposures they add or risks they help neutralize at the total fund level. We argue that commodities improve the risk factor exposures that ultimately enhance total portfolio resilience across market cycles.
Inflation Sensitivity: Commodities complement fixed income strategies when rate volatility and traditional hedges (e.g. TIPS) contribute to headwinds.
Equity Beta: Commodities reduce total portfolio concentration risk during equity stress periods and valuation corrections.
Duration and Credit risk: Commodities balance total portfolio duration exposure when rate cycles pressure fixed income returns.
Return Enhancement: Structural demand drivers create value-add opportunities beyond traditional resource allocations.
If we dissect the risk factors in a typical portfolio, we can further understand the impact of commodities. In Table 1, we have gone from no commodities to commodity beta (i.e., Bloomberg Commodity or GSCI) to commodity exposure using risk factors like Trend, Volatility-based position sizing, and term structure - areas seasoned commodity traders have particular expertise in.
Table 1: Total Fund Risk Management: Impact of Commodities
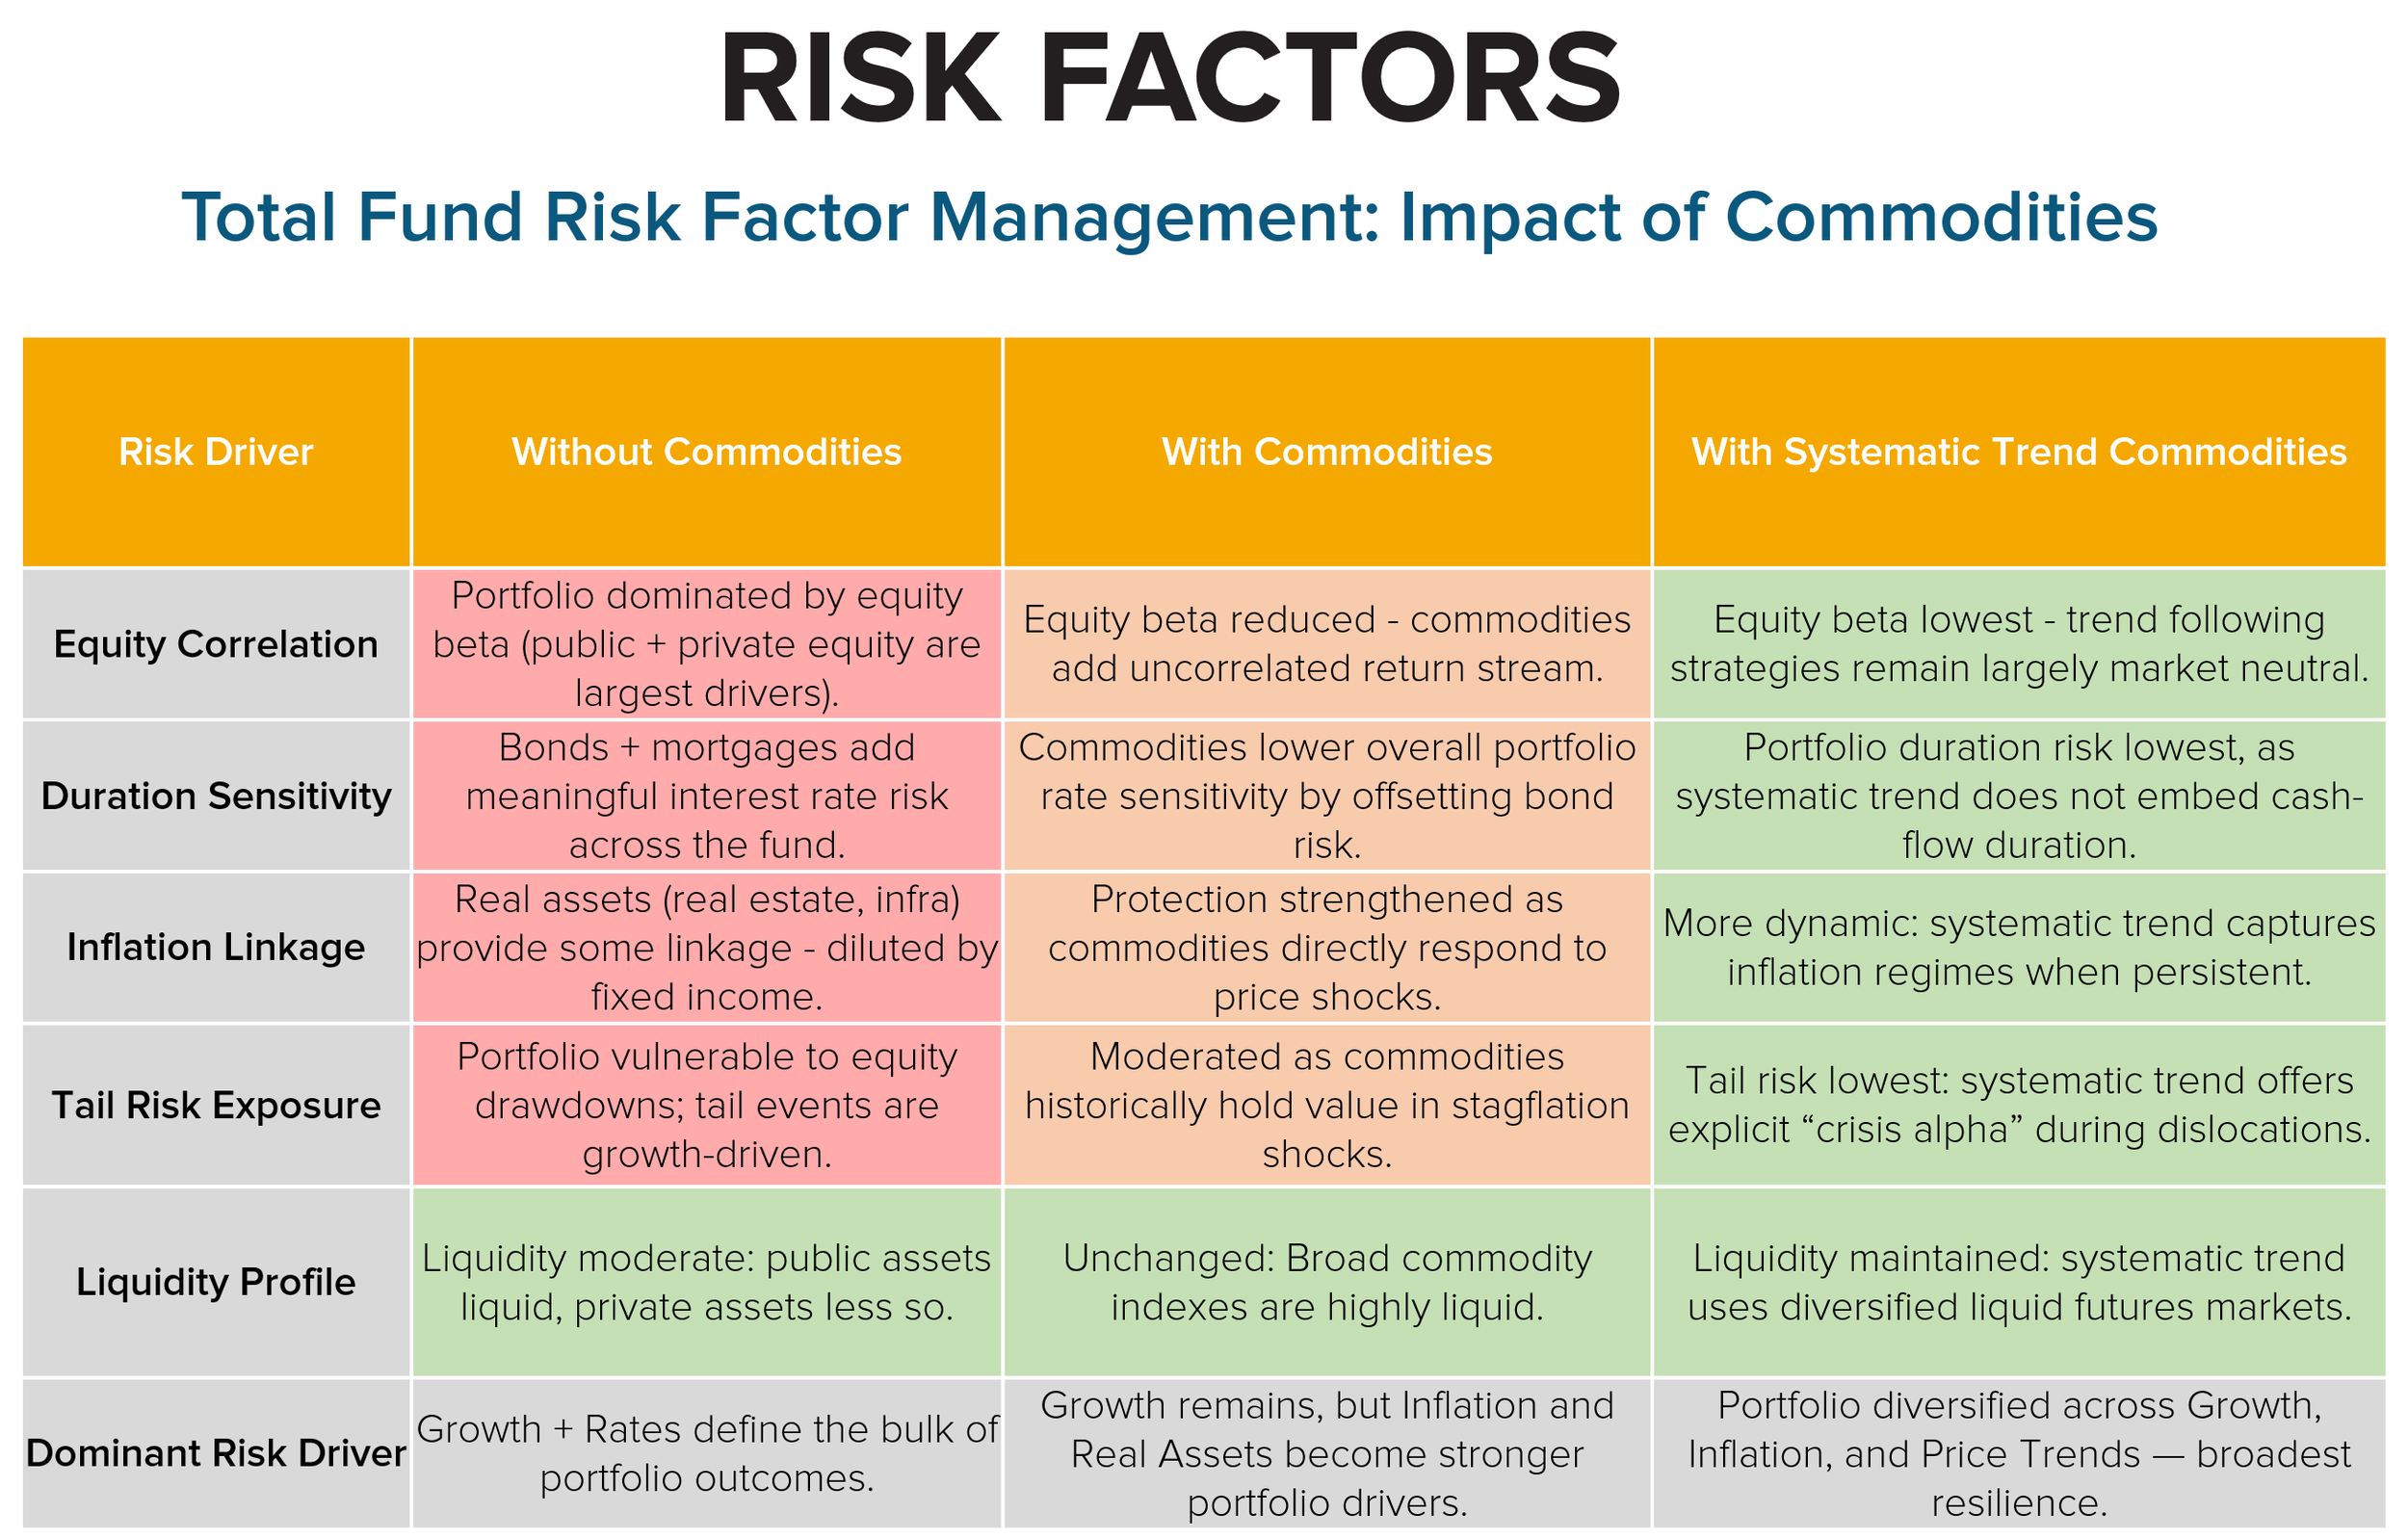
Source: Auspice Capital Advisors
Liquidity and Capital Efficiency
A big advantage in gaining exposure to commodities is they are liquid, futures-based exposures. In TPM, this is powerful because it enables the exposure to commodities to be layered via overlays (rather than competing with illiquids like infra/PE for scarce capital). Some call this portable alpha and some say "Return Stacking." At Auspice we recently published a white paper on this topic. Investors can add exposures at the total fund level - such as commodities and CTAs - without diverting capital from other allocations (see Figure 3 below). Just as importantly, these exposures can be sized/adjusted flexibly and dynamically on a daily basis. In short, return stacking may deliver capital efficiency by accessing multiple return drivers without reducing core exposures - ideal for TPM.
Figure 3: Return Stacking/Portable Alpha – Construction/Implementation

Is this approach available to all alternatives? No.
This is where commodity and CTA managers may be able to achieve a “structural alpha” by virtue of using futures, traded on margin. It typically takes less than 30% of the investor capital to generate the exposure. In a fund structure, this means the bulk of capital is earning a cash return. In the case of an overlay, it means it takes very little capital to add these potentially accretive exposures.
Combating Inflation
Commodities are an exciting asset class for many reasons, but importantly, because they are the most diverse asset class. We often say: “Cotton is not like Crude is not like Canola.” Each market is unique, with its own drivers and opportunities. The challenge, of course, is picking the right ones.
At Auspice, we believe our edge lies in quantitative trend following, disciplined risk management, and maintaining a broad, diversified portfolio. We recognize that no single commodity tells the whole story. Gold, for example, is often assumed to be a universal inflation hedge - but the data says otherwise. As inflation surged in the second half of 2020, gold flatlined and didn’t meaningfully move again until inflation began to moderate in 2023 and 2024.
As Figure 4 highlights, Gold’s history as an inflation hedge is inconsistent, influenced by monetary policy, sentiment, and currency fluctuations.
Figure 4: Gold vs Broad Commodities
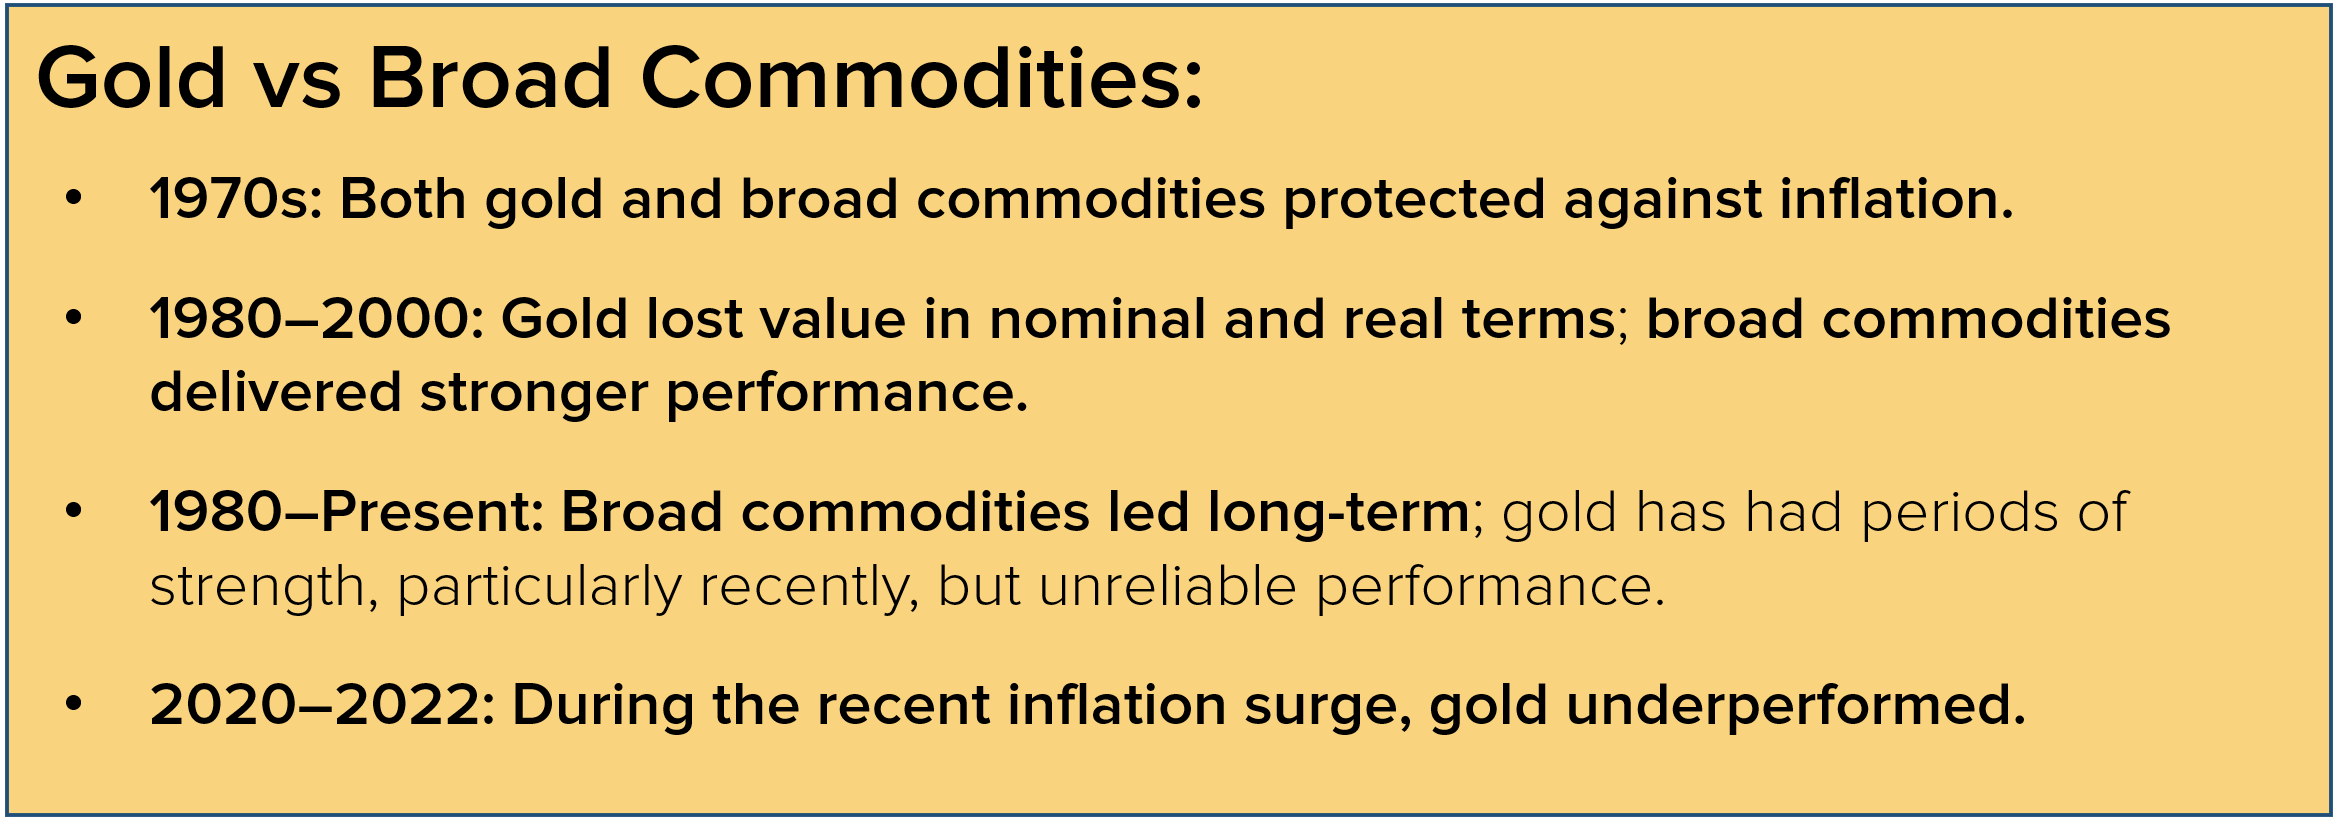
Source: Auspice Capital Advisors
Had you invested in Gold in April 2020, you did not gain an effective hedge. Consider Chart 1.
Chart 1: Gold vs Broad Commodities May 2020 – May 2022
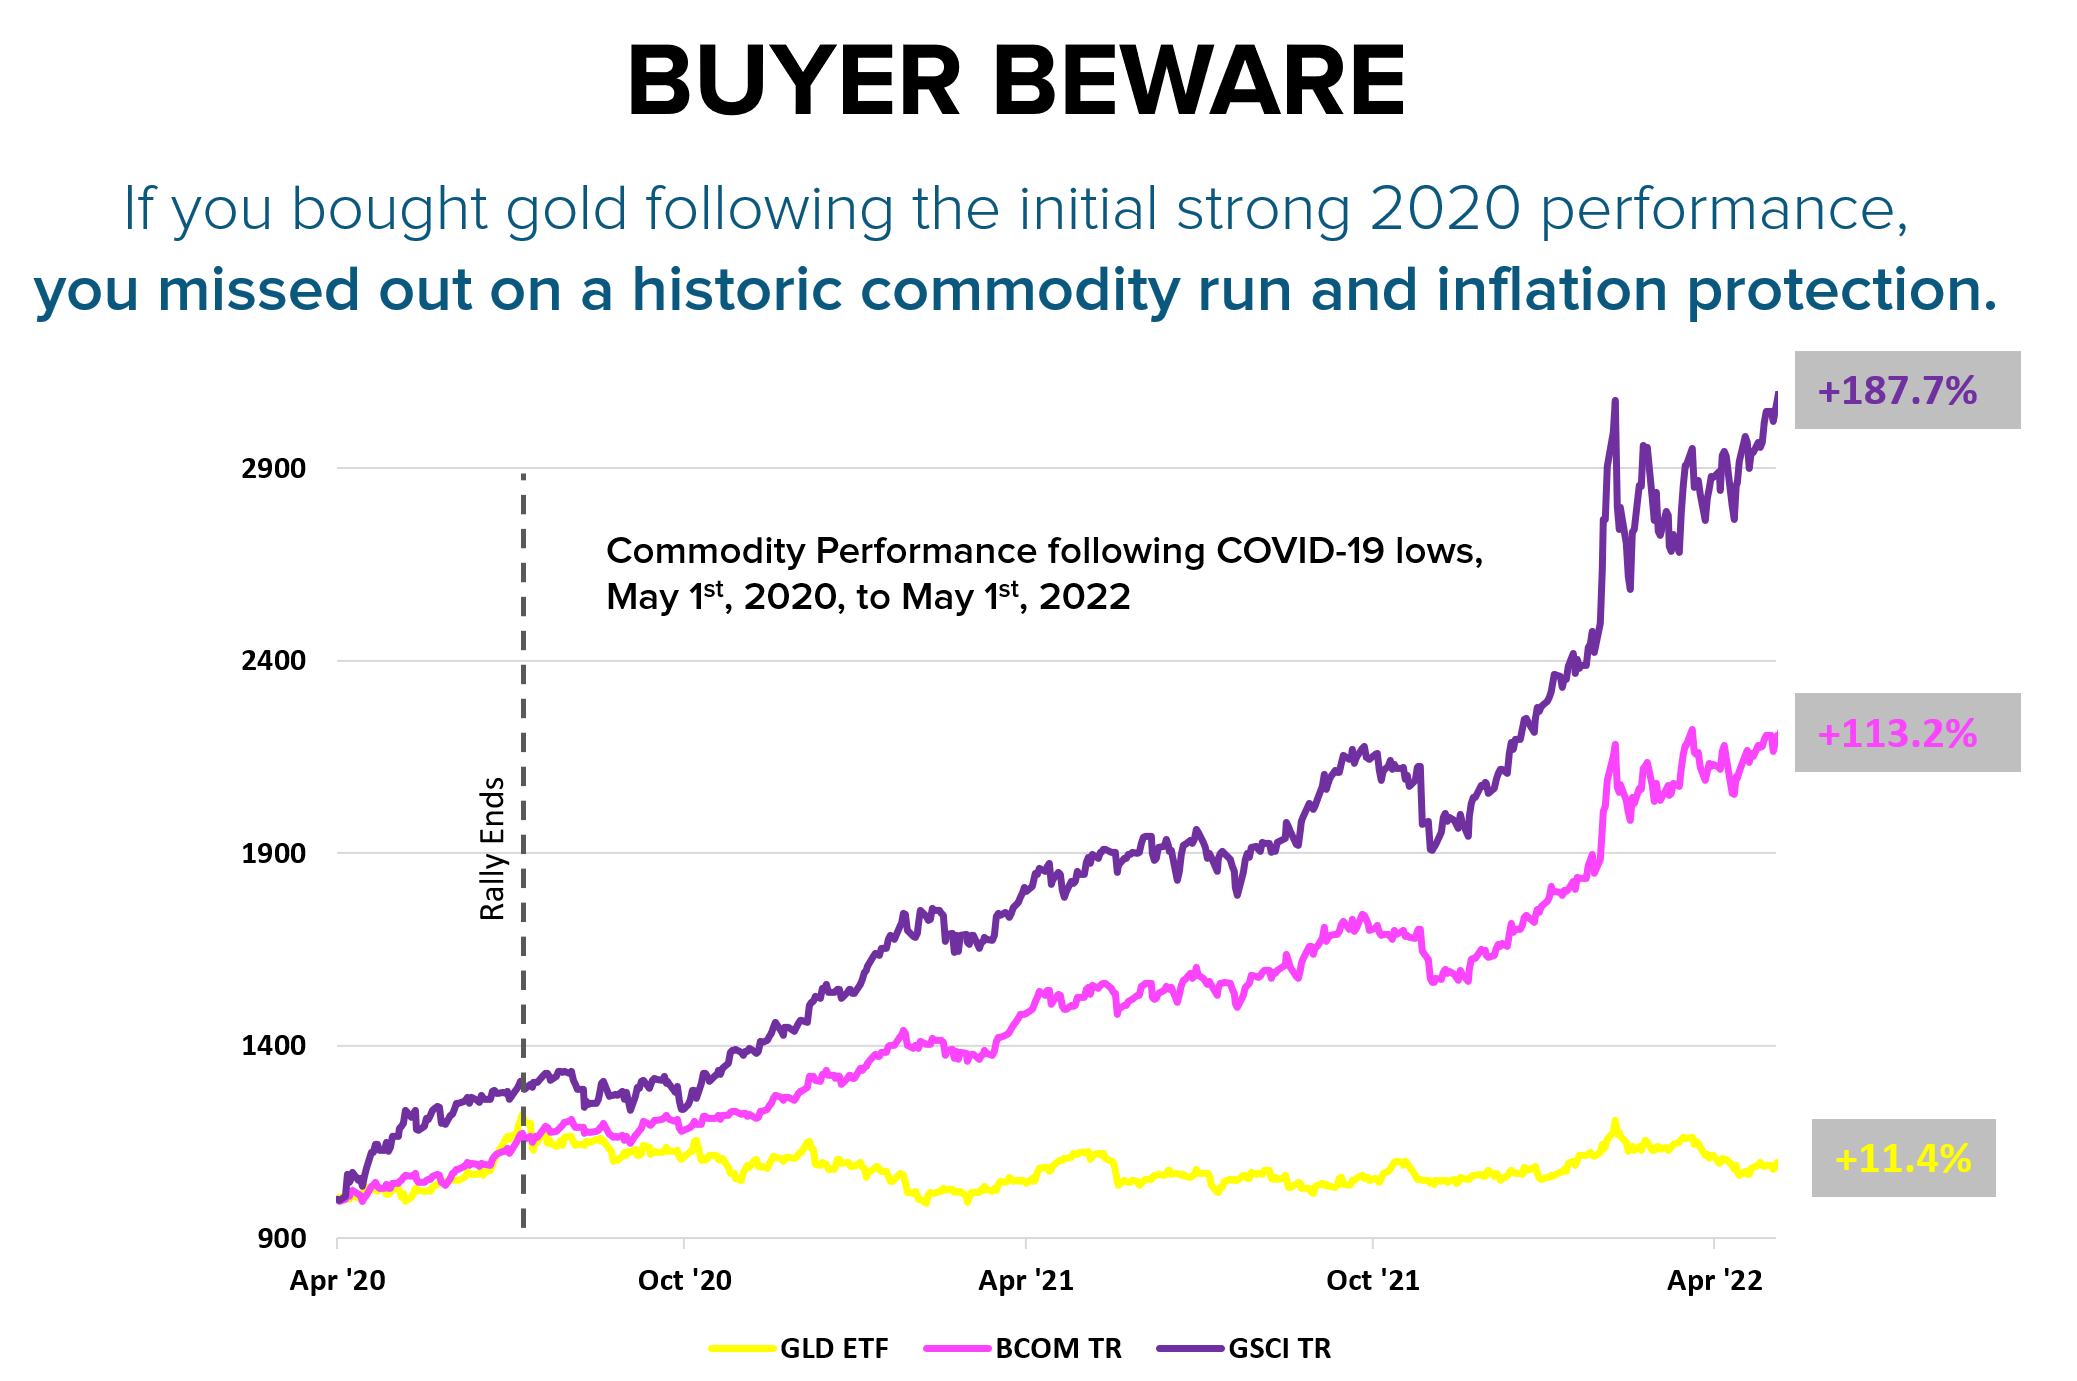
Source: Bloomberg & Auspice Capital Operations
In fact, highlighted in Chart 2, it took four decades for gold to catch up with broad commodity benchmarks. While gold has recently rallied, investors should be careful chasing recent performance.
Chart 2: Gold vs Broad Commodities Jan 1980 – May 2025
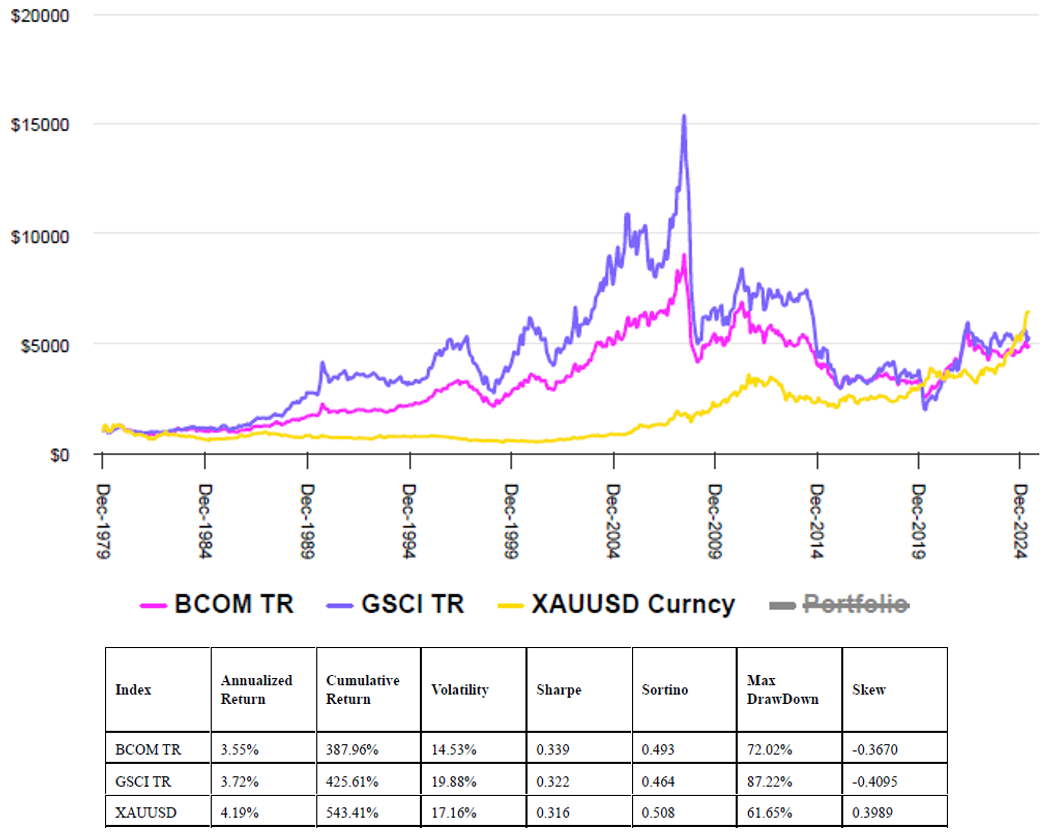
Source: Bloomberg and Auspice Capital Operations
For the total portfolio approach, if we look at the Inflation risk factor, we can recognize that at current CPI levels of ~2.9% (August reading) are right near the 100-year average of 3%. As illustrated in Figure 5, after a strong inflationary push to start the 1970’s inflation moderated - only to take off again from 1976, creating a much more prolonged challenge for portfolios.
Figure 5: Historic Inflation Cycle (Period Ending 08/31/2025)
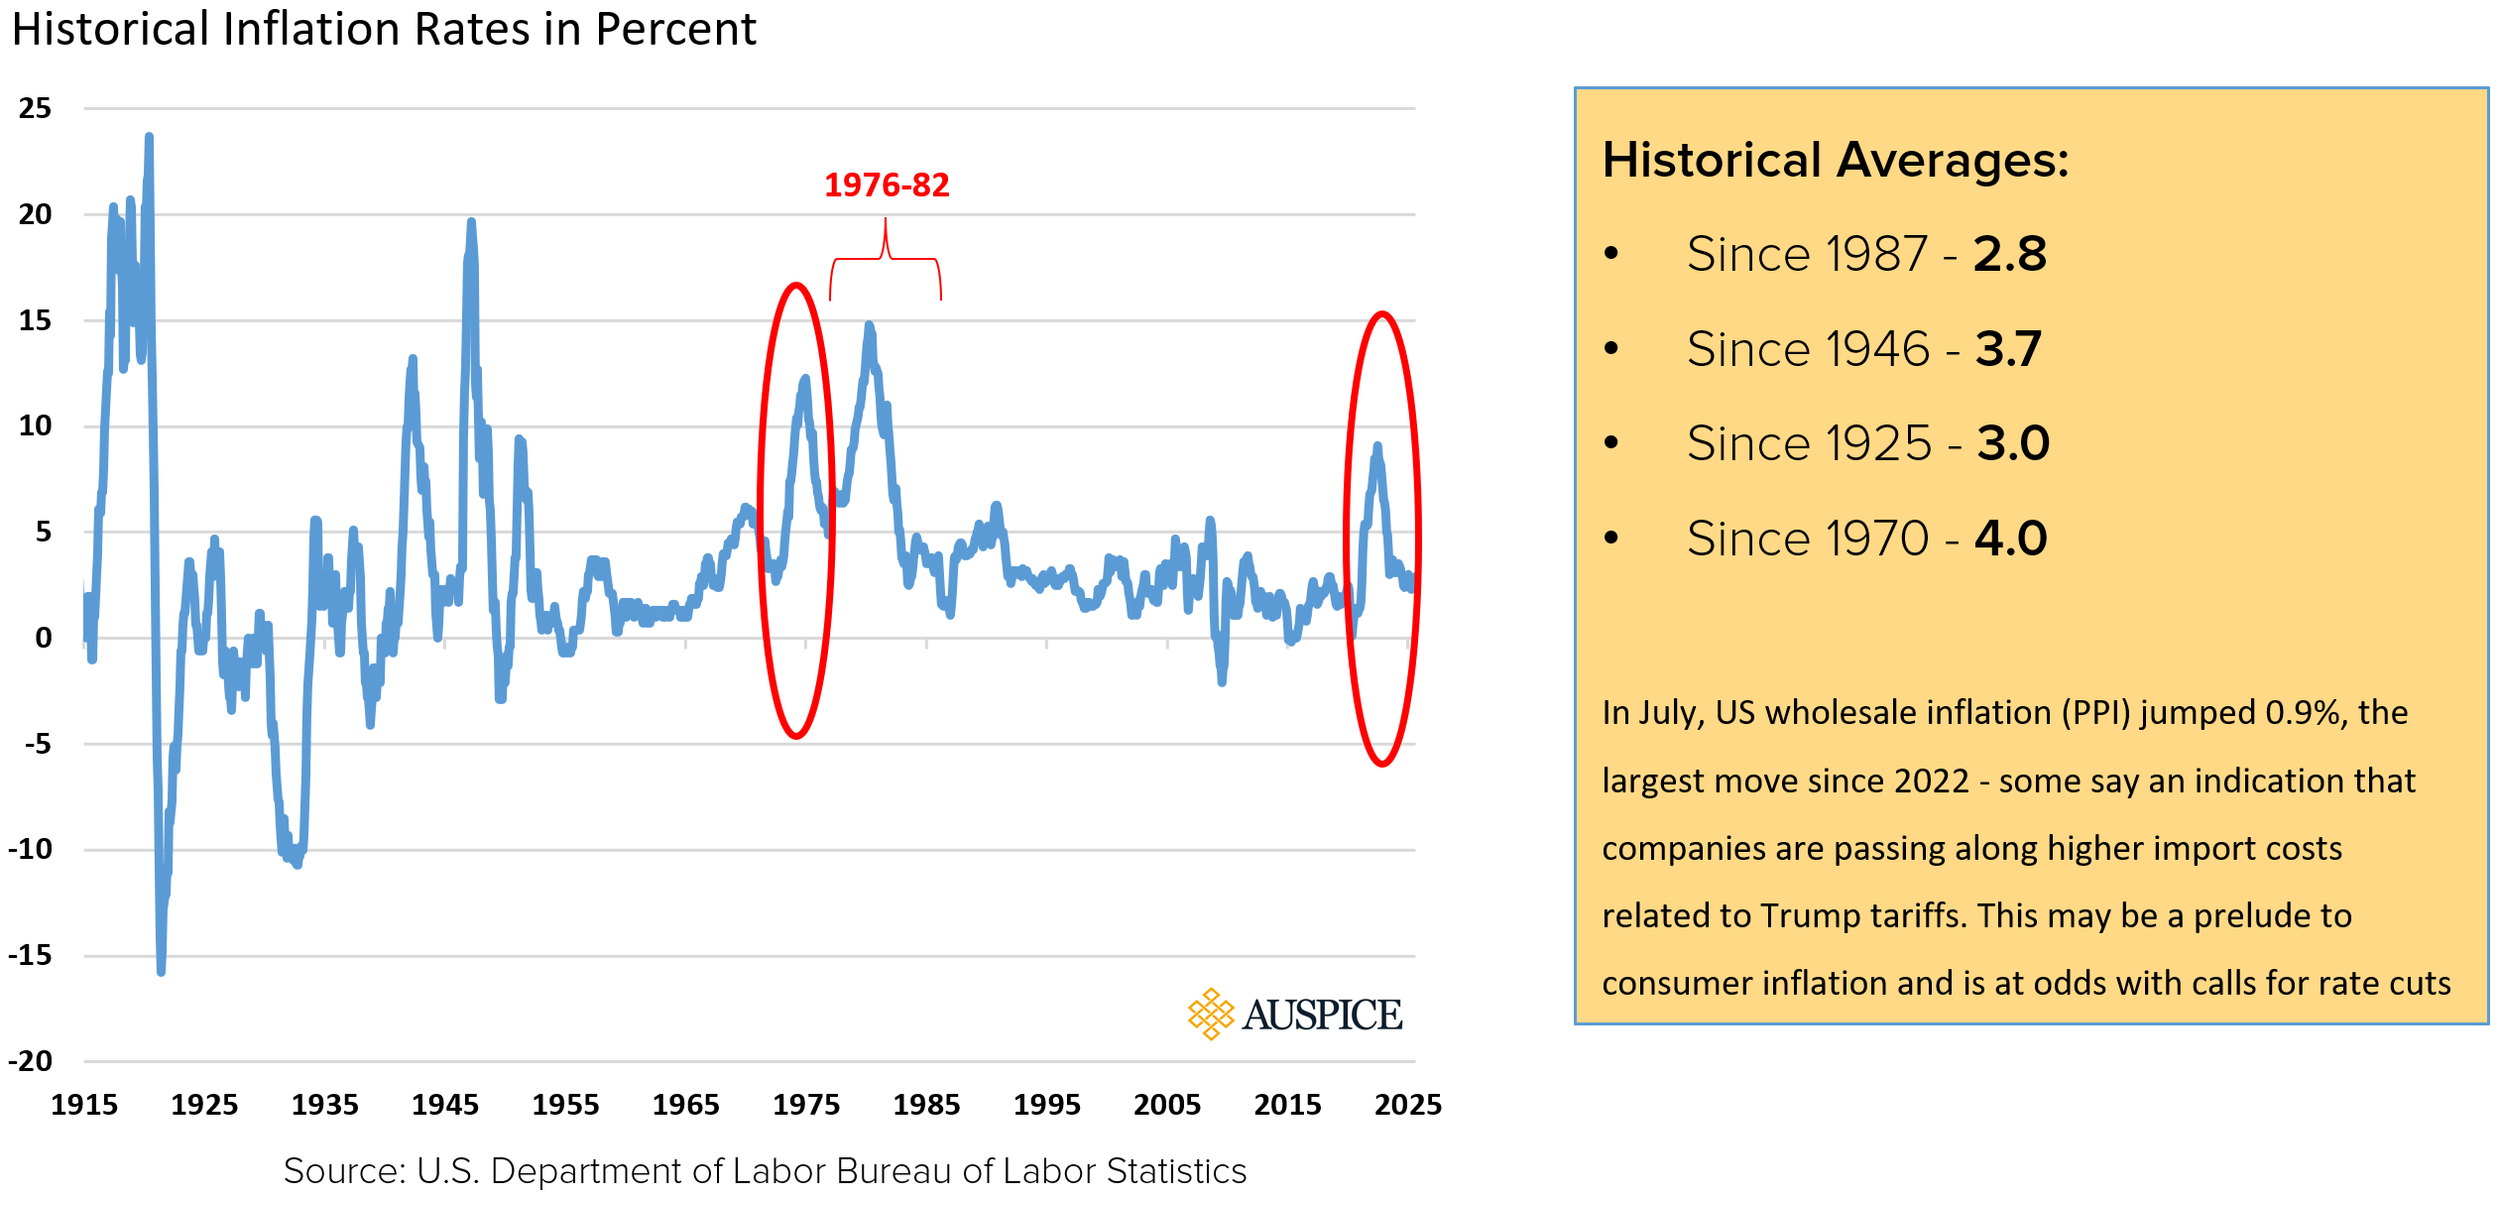
The current red circled areas in Figure 5 look a lot like the past. If we overlay these two time periods in Figure 6, it is uncanny. As they say, history may not repeat, but it may rhyme (please refer to the Important Disclaimers and Notes section for forward-looking disclaimer information, including that history is not a predictor of future results).
Figure 6: US Inflation - Then vs Now

If we focus on this time period, had an investor moved from a 60/40 stock/bond portfolio to 20% commodity (BCOM beta used in this case) the portfolio did better as shown in the hypothetical performance within figure 7. Had they kept the 60/40 and added 20% on top, its even better.
Please note: hypothetical performance results have many inherent limitations, some of which are described within the Important Disclaimers and Notes section. No representation is being made that any account will or is likely to achieve profits or losses similar to those shown below. In fact, there are frequently sharp differences between hypothetical performance results and the actual results subsequently achieved by any particular trading program.
Figure 7: 1976-1982 Total Portfolio Performance
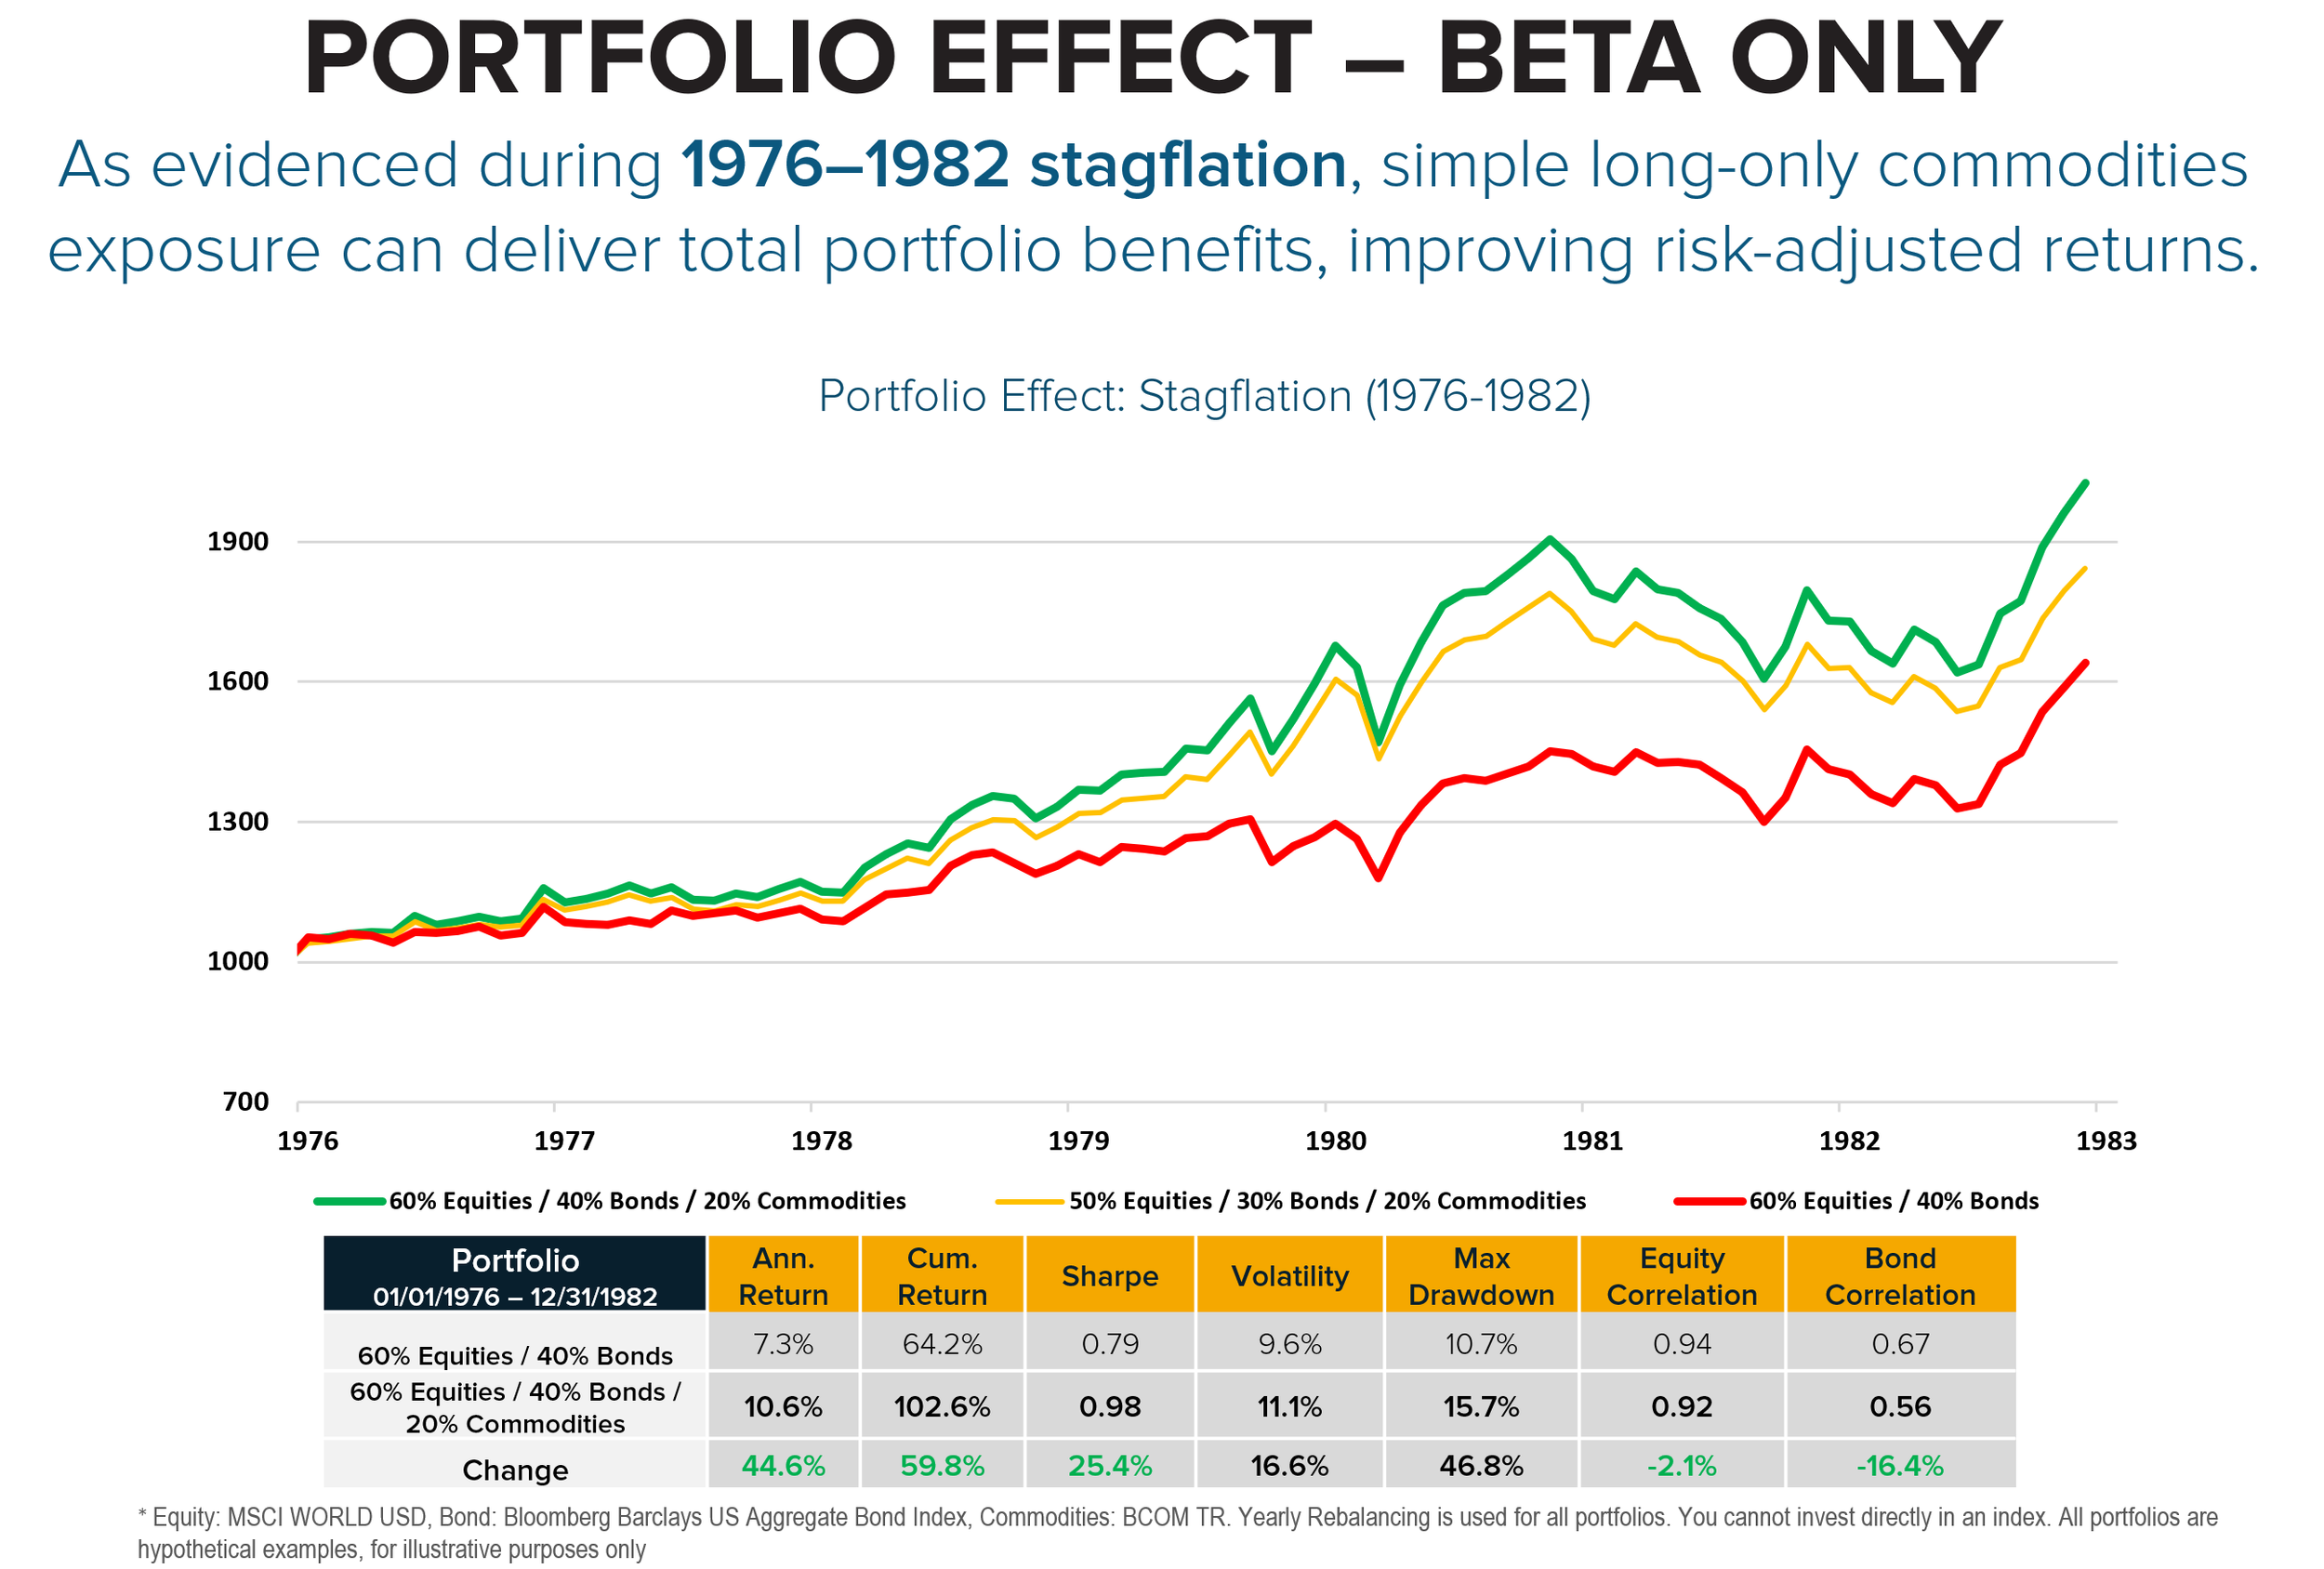
Source: Bloomberg Bloomberg and Auspice Capital Operations
This is the opportunity for investors (large or small) to strengthen their portfolios. For retail investors, simply adding the diversification potentially provides a portfolio benefit. For institutions with the ability to run a portable alpha overlay, the case is even more compelling. The TPM framework, when paired with notionally funded commodity and CTA overlays, provides a natural alignment that delivers diversification and capital efficiency without sacrificing core exposures.
Institutional Adoption
Ontario Teachers’ Pension Plan (OTPP) has long been a top performer and a first mover in adopting the Total Portfolio Approach. Commodities now make up 11% of its $269 billion portfolio ($29.7 billion), see Chart 3. As former CIO Ziad Hindo explained:
“What we know historically is that inflation is not really kind to traditional asset classes … stocks or bonds. Commodity prices, on the other hand, tend to rise when inflation is on an upward trajectory and provide a hedge against it.”
Chart 3: OTPP Portfolio H1 2025
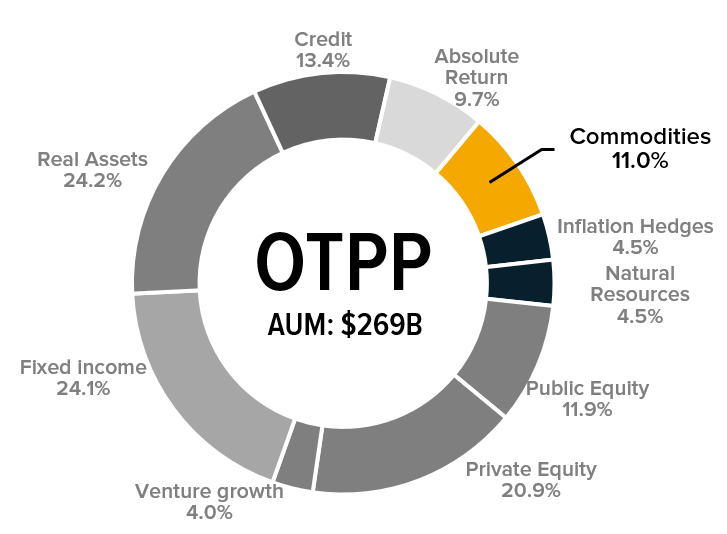
Source: OTPP
OTPP is not alone. Other sophisticated allocators are following suit: CAAT has allocated roughly 3% to commodities[3], the University of Alberta’s endowment holds 3.1%[4], and the Indiana Public Retirement System (INPRS) has gone a step further - with an explicit commodities mandate that will add another $2 billion USD, bringing its portfolio-wide exposure close to 10%[5].
The result is a growing consensus among the world’s most sophisticated allocators: the Total Portfolio Management is not a passing trend but a durable shift in how capital is managed, with commodities playing a critical role in that evolution.
If you are seeking commodity exposure - or would like to begin exploring how to incorporate it into your portfolio - email us today at info@auspicecapital.com
SOURCES
[1] https://www.thinkingaheadinstitute.org/content/uploads/2020/11/Total_Portfolio_Approach-1.pdf
[2] https://caia.org/blog/2024/03/19/next-here-rise-total-portfolio-approach
[3] https://www.caatpension.ca/content/dam/caatwebsite/documentprocessed/annual-report/2024/CAAT-PensionPlan_Annual_Report_2024-EN.pdf
[4] https://www.ualberta.ca/en/university-services-operations-finance/media-library/initiatives/uep-investment-holdings-final-2025.pdf
[5] https://secure.in.gov/inprs/files/RFP25-03_ActiveDiversifiedCommoditiesInvestmentManagement.pdf
DEFINITIONS
Indices
Indices and benchmarks are used for comparison purposes only or to illustrate comparisons against other widely used indices or benchmarks most commonly referenced by investors. Index statistics/data are sourced from Bloomberg. You cannot invest directly in an index.
The Bloomberg Commodity Index Total Return (BCOM TR) Index is a broadly diversified commodity price index that tracks prices of futures contracts on physical commodities on the commodity markets. No one commodity can compose more than 15% of the BCOM ER index, no one commodity and its derived commodities can compose more than 25% of the index, and no sector can represent more than 33% of the index.
S&P GSCI Total Return Index (GSCI TR) – A production-weighted commodity index covering a broad range of raw materials, including energy (crude oil, natural gas, gasoline, heating oil), metals (gold, silver, aluminum, copper, lead, nickel, zinc), agriculture (wheat, corn, soybeans, cotton, coffee, sugar, cocoa), and livestock (live cattle, feeder cattle, lean hogs). Its weighting heavily favors energy, making it sensitive to crude oil price movements.
XAUUSD Index (XAUUSD) - The XAUUSD index, also known as simply XAUUSD, represents the price of one troy ounce of gold (XAU) quoted in US dollars (USD). It's a popular trading pair in the foreign exchange (forex) market, indicating the cost of gold in US dollar terms. Essentially, it shows how many US dollars are needed to purchase one ounce of gold.
IMPORTANT DISCLAIMERS AND NOTES
There is a substantial risk of loss in trading futures and options. Past performance is not necessarily indicative of future results.
The hypothetical performance shown is not actual performance. Hypothetical performance has inherent limitations and does not represent actual trading. No representation is being made that any account will or is likely to achieve performance results similar to those shown within this chart. The results are based on simulated or historical data, not actual trading. The hypothetical performance shown does not reflect the deduction of advisory fees, trading commissions or other expenses that would be incurred in an actual account. Other factors, such as market impact, may adversely affect the actual trading results.
Commissions, trailing commissions, management fees and expenses may all be associated with investment funds. Please read the prospectus or applicable offering document before investing. Investment funds are not guaranteed, their values change frequently and past performance may not be repeated.
These materials are provided for informational and educational purposes and are not intended to provide specific individual advice including, without limitation, investment, financial, legal, accounting and tax. Please consult with your own professional advisor on your particular circumstances.
Futures trading is speculative and is not suitable for all customers. Past results are not necessarily indicative of future results. This document is for information purposes only and should not be construed as an offer, recommendation or solicitation to conclude a transaction and should not be treated as giving investment advice. Auspice Capital Advisors Ltd. (the “Manager” or “Auspice”) makes no representation or warranty relating to any information herein, which is derived from independent sources. No securities regulatory authority has expressed an opinion about the securities offered herein and it is an offence to claim otherwise. Please read the applicable offering documents before investing.
This material may contain forward-looking statements, which were prepared for the purpose of providing general educational background information and may not be appropriate for other purposes. Certain statements in this document are forward- looking statements, including those identified by the expressions “anticipate”, “believe”, “plan”, “estimate”, “expect”, “intend”, “target”, “seek”, “will” and similar expressions to the extent they relate to an Auspice managed investment fund (the “Fund”), where applicable, and the Manager. Forward- looking statements are not purely historical facts but reflect the current expectations of the Fund, where applicable, and the Manager regarding future results or events. Such forward-looking statements reflect the Fund’s, where applicable, and the Manager’s current, reasonable beliefs and are based on information currently available to them. Forward-looking statements are made with assumptions and involve significant risks and uncertainties. Although the forward-looking statements contained in this document are based upon assumptions that the Fund, where applicable, and the Manager believe to be reasonable, neither the Fund, where applicable, or the Manager can assure investors that actual results will be consistent with these forward-looking statements. There is no guarantee that any forward-looking statement will come to pass. As a result, readers are cautioned not to place undue reliance on these statements as a number of factors could cause actual results or events to differ materially from current expectations.
Neither the Fund, where applicable, nor the Manager assumes any obligation to update or revise any forward-looking statement to reflect new events or circumstances, except as required by law.
The Manager may present the enclosed information a blog – such blog may contain hypertext links to web sites owned and controlled by parties other than Auspice. We have no control over any third-party-owned web sites or content referred to, accessed by or available on such web site and therefore we do not endorse, sponsor, recommend or otherwise accept any responsibility for such third-party web sites or content or for the availability of such web sites. In particular, we do not accept any liability arising out of any allegation that any third-party-owned content (whether published on this or any other web site) infringes the intellectual property rights of any person, or any liability arising out of any information or opinion contained on such third-party web site or content.