
To download the Auspice August Blog as a PDF, click here.
In a month full of conflicting signals, global stocks climbed to a record level while Treasury yields dropped. Inflation data showed CPI persistence alongside the highest jump in PPI in 3 years, making predicting the direction of commodity, equity, or bond markets challenging. Meanwhile, the US Dollar has trended down for much of the year, seemingly in line with the Trump administration’s goal of benefiting American exporters. The risk is that consumers, as massive importers of global goods, could feel a pinch.
As trend followers, we are agnostic as to market direction. We are content with taking what the market gives us but it is not without its challenges. Often, the market doesn't simply trend up or down but is sideways, choppy, and full of back-and-forth, violent whipsawing. We have seen plenty of that recently - the change of tariff course for copper, specifically excluding refined copper, was the driver of a one-day 20% correction in that commodity. This occurred after threatened tariffs were assumed to be on both semi-manufactured and refined copper but ended up only on the former. Events like this serve as a reminder that trend following strategies are a powerful way to navigate markets, but risk management is the real edge.
When taking a view on macro forces, we can apply the same principles of trend following and risk discipline alongside some forecasting, based on human nature, to back out the outcomes central banks and politicians want for their economies.
Our Early Warning Signs
Back in late 2019, we viewed the possibility of rising inflation as a situation worth monitoring. Rates were low with inflation almost non-existent alongside a low volatility market and upwards trending equities. The economy appeared strong. When we mentioned stagflation, people looked at us like we had three heads. The story that followed was dramatic - with COVID as a black swan and years of underinvestment in commodity infrastructure, the catalysts mounted, and commodities took off as inflation hit hard. CPI rose from nearly zero to 9%.
Why Commodities Protected While Gold Disappointed
We argue that the best protection for portfolios was commodities (see ‘Inflation Surge’ period in Chart 1). As central banks moved up interest rates, again from nearly zero, this helped. It is generally understood that central banks raise rates in an attempt to control inflation. Yet what is less understood is that raising rates only affects our spending, the so-called “demand-pull inflation” associated with the purchase of manufactured goods. This does little to control the “cost-push inflation” associated with commodity prices and wages. Central banks can’t control commodity prices nor their supply since raising rates neither increases short-term commodity supplies nor attracts long-term commodity infrastructure investments.
Chart 1: Commodities Outpace Gold During Inflationary Surge (2020–2022)

Although inflation has moderated, it has not disappeared - not even to the Fed's 2% target. Wage pressure and unionization remain rampant (just ask a Canadian flying Air Canada). While commodities have eased in the last few years, we argue the fundamental set-up of a commodity super-cycle remains.
Current Inflationary Pressures Persist
Highlighted by Otavio Costa from Crescat Capital, "It's interesting to see some people claim inflation is slowing. The equal-weighted commodities index is up 12% in the past year. That’s real-world inflation. Meanwhile, US money supply just hit a new high, and the dollar is weakening sharply against other currencies, including emerging markets. Inflation is far from contained, in my view" (See Chart 2 below).
Chart 2: US Inflation: Then vs Now (1967-1983 and 2015-Today)
Commodity Demand Drivers Remain Strong
Copper remains in demand along with other base metals, such as steel, aluminum, and zinc, as well as precious metals like silver, platinum, and palladium. Per Adam Posen, President at the Peterson Institute for International Economics, US metal tariffs will lead to inflation[1]. This is not forgetting the energy commodities to power record-high US power use[2], nor the agricultural markets to feed the fastest-growing middle class in the world, India.
Debunking the Gold-as-Inflation-Hedge Myth
As we outlined in the Auspice February Blog, a common misnomer is that Gold is a hedge for inflation. That is simply not the case. Gold could be better understood as a statistical diversifier. Its value in a portfolio comes from its unique drivers, being a commodity, store of value, or currency, but it is not an inflation hedge. Gold underperformed in the inflation surge of 2020-2022: in fact, it was one of the worst-performing commodities.
Historical Evidence Against Gold as Inflation Protection
Historically, we see the same pattern:
1970s: Both gold and broad commodities protected against inflation.
1980–2000: Gold lost value in nominal and real terms; broad commodities delivered stronger performance.
1980–Present: Broad commodities led long-term; gold has had periods of strength, particularly recently as inflation moderated, but unreliable performance.
2020–2022: During the recent inflation surge, gold underperformed.
From the 1980's, it took four decades for gold to catch up with broad commodities (See Chart 3 below). Gold has recently rallied yet investors should be careful chasing recent performance. The price of Gold only started to move in 2023 as CPI started to moderate (alongside other risk assets like Bitcoin). Its upside has slowed or stopped since April.
Chart 3: Long-Term Performance of Commodities vs. Gold (1980–2025)
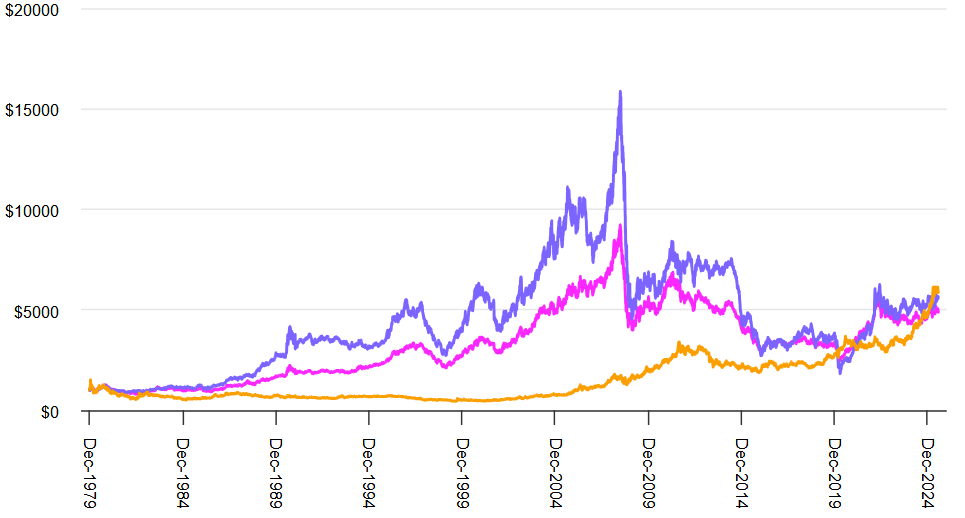


Source: Bloomberg and Auspice Capital Operations, as at July 31st, 2025. You cannot invest directly in an index.
WHAT HAPPENS NEXT?
Per Bloomberg, while headline CPI held steady at 2.7%, just below the long-term 100-year average of 3%, “Core inflation” (excluding food and energy) jumped to 3.1% (See Chart 4). In July, US wholesale inflation (PPI) jumped 0.9%, the largest move since 2022 - some say an indication that companies are passing along higher import costs related to Trump tariffs. This may be a prelude to consumer inflation and is at odds with calls for rate cuts[3].
Chart 4: Core CPI Rebounds in July as Inflation Momentum Builds

Source: Bloomberg
We believe we are in the same position as many times in the past and in 2020. Gold and other metals tend to respond first to the inflationary threat, but their performance is often driven by different dynamics and can resemble that of other risk assets even in "disinflationary" periods. As inflation hits or persists, a broader commodity approach has historically been most effective as different commodity markets respond in unique ways. The Trump administration wants to lower rates in the US (as the central bank just did in the UK), and they understand the risk of inflation and may be okay with it. Lowering rates helps the economy and moves away from stagflation, and per Fed Chair Jerome Powell’s comments on August 22, this is a distinct possibility[4]. This points towards a growth economy with inflation and lower rates – conditions where commodities are arguably the best hedge.
SOURCES
[1] https://www.youtube.com/watch?v=UjfWQkv2YH0
[2] https://www.reuters.com/business/energy/data-center-demand-push-us-power-use-record-highs-2025-26-eia-says-2025-06-10/
[3] https://www.bloomberg.com/news/articles/2025-08-14/us-producer-prices-rise-by-most-in-three-years-on-services
[4] https://www.reuters.com/markets/wealth/powell-says-fed-may-need-cut-rates-will-proceed-carefully-2025-08-22/
DEFINITIONS
Indices
Indices and benchmarks are used for comparison purposes only or to illustrate comparisons against other widely used indices or benchmarks most commonly referenced by investors. Index statistics/data are sourced from Bloomberg. You cannot invest directly in an index.
The Bloomberg Commodity Index Total Return (BCOM TR) Index is a broadly diversified commodity price index that tracks prices of futures contracts on physical commodities on the commodity markets. No one commodity can compose more than 15% of the BCOM ER index, no one commodity and its derived commodities can compose more than 25% of the index, and no sector can represent more than 33% of the index.
S&P GSCI Total Return Index (GSCI TR) – A production-weighted commodity index covering a broad range of raw materials, including energy (crude oil, natural gas, gasoline, heating oil), metals (gold, silver, aluminum, copper, lead, nickel, zinc), agriculture (wheat, corn, soybeans, cotton, coffee, sugar, cocoa), and livestock (live cattle, feeder cattle, lean hogs). Its weighting heavily favors energy, making it sensitive to crude oil price movements.
XAUUSD Index (XAUUSD) - The XAUUSD index, also known as simply XAUUSD, represents the price of one troy ounce of gold (XAU) quoted in US dollars (USD). It's a popular trading pair in the foreign exchange (forex) market, indicating the cost of gold in US dollar terms. Essentially, it shows how many US dollars are needed to purchase one ounce of gold.
IMPORTANT DISCLAIMERS AND NOTES
There is a substantial risk of loss in trading futures and options. Past performance is not necessarily indicative of future results.
The hypothetical performance shown is not actual performance. Hypothetical performance has inherent limitations and does not represent actual trading. No representation is being made that any account will or is likely to achieve performance results similar to those shown within this chart. The results are based on simulated or historical data, not actual trading. The hypothetical performance shown does not reflect the deduction of advisory fees, trading commissions or other expenses that would be incurred in an actual account. Other factors, such as market impact, may adversely affect the actual trading results.
Commissions, trailing commissions, management fees and expenses may all be associated with investment funds. Please read the prospectus or applicable offering document before investing. Investment funds are not guaranteed, their values change frequently and past performance may not be repeated.
These materials are provided for informational and educational purposes and are not intended to provide specific individual advice including, without limitation, investment, financial, legal, accounting and tax. Please consult with your own professional advisor on your particular circumstances.
Futures trading is speculative and is not suitable for all customers. Past results are not necessarily indicative of future results. This document is for information purposes only and should not be construed as an offer, recommendation or solicitation to conclude a transaction and should not be treated as giving investment advice. Auspice Capital Advisors Ltd. (the “Manager” or “Auspice”) makes no representation or warranty relating to any information herein, which is derived from independent sources. No securities regulatory authority has expressed an opinion about the securities offered herein and it is an offence to claim otherwise. Please read the applicable offering documents before investing.
This material may contain forward-looking statements, which were prepared for the purpose of providing general educational background information and may not be appropriate for other purposes. Certain statements in this document are forward- looking statements, including those identified by the expressions “anticipate”, “believe”, “plan”, “estimate”, “expect”, “intend”, “target”, “seek”, “will” and similar expressions to the extent they relate to an Auspice managed investment fund (the “Fund”), where applicable, and the Manager. Forward- looking statements are not purely historical facts but reflect the current expectations of the Fund, where applicable, and the Manager regarding future results or events. Such forward-looking statements reflect the Fund’s, where applicable, and the Manager’s current, reasonable beliefs and are based on information currently available to them. Forward-looking statements are made with assumptions and involve significant risks and uncertainties. Although the forward-looking statements contained in this document are based upon assumptions that the Fund, where applicable, and the Manager believe to be reasonable, neither the Fund, where applicable, or the Manager can assure investors that actual results will be consistent with these forward-looking statements. There is no guarantee that any forward-looking statement will come to pass. As a result, readers are cautioned not to place undue reliance on these statements as a number of factors could cause actual results or events to differ materially from current expectations.
Neither the Fund, where applicable, nor the Manager assumes any obligation to update or revise any forward-looking statement to reflect new events or circumstances, except as required by law.
The Manager may present the enclosed information a blog – such blog may contain hypertext links to web sites owned and controlled by parties other than Auspice. We have no control over any third-party-owned web sites or content referred to, accessed by or available on such web site and therefore we do not endorse, sponsor, recommend or otherwise accept any responsibility for such third-party web sites or content or for the availability of such web sites. In particular, we do not accept any liability arising out of any allegation that any third-party-owned content (whether published on this or any other web site) infringes the intellectual property rights of any person, or any liability arising out of any information or opinion contained on such third-party web site or content.