
To download the Auspice July Blog as a PDF, click here.

For liquid public market strategies, there tends to be a universal trade-off between diversification and performance. As a strategy approaches zero equity correlation and becomes negative, returns generally become lower[1]. For example, one would be hard pressed to find a strategy with a 0.5 Sharpe or higher, and an equity correlation between -1.0 and -0.5. Simply put, it does not exist.
Chart 1: The Investment Trade-Off… Broken.
Most strategies fall within the white spectrum – strong diversification can come at the cost of performance. Return stacking equities plus trend following CTAs move beyond the spectrum, offering higher returns and built in diversification.
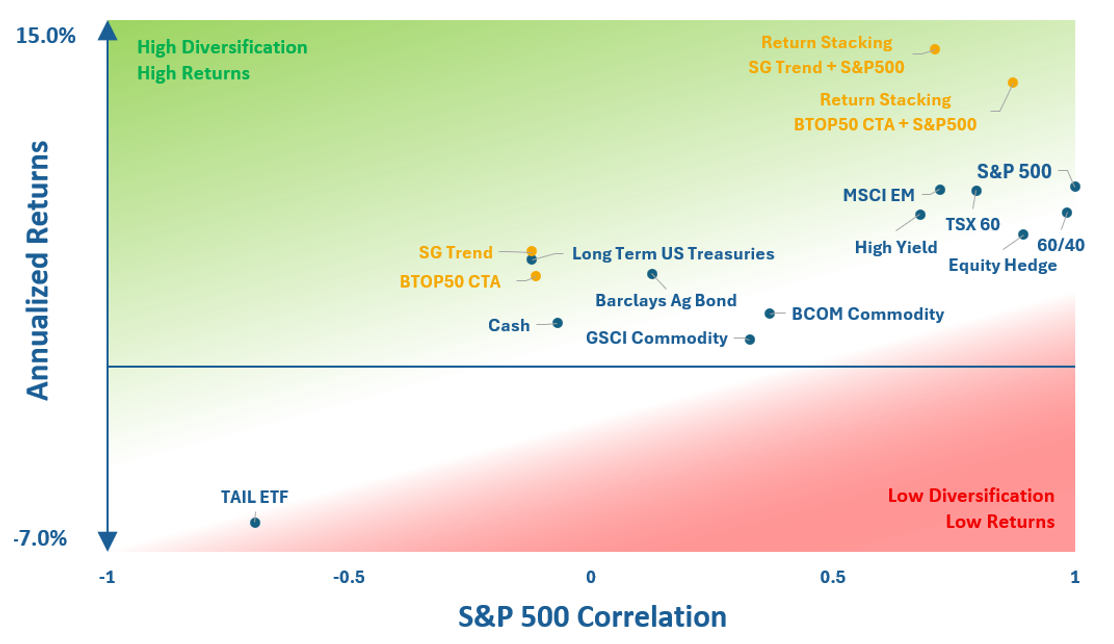
Chart 1 performance January 1st, 2000, through June 30th, 2025, except the TAIL ETF which has an April 5th, 2017, inception. See full definitions at end. All Indexes are Total Return. Equity Hedge: CBOE S&P 500 5% Put Protection Index. High Yield: Bloomberg Barclays US Corporate High Yield Index. MSCI EM: MSCI Emerging Markets Net Index. Cash: Bloomberg US Treasury Bills Index. Long Term Treasuries: Bloomberg Barclays US Treasury 20+ Year Total Return Index. TAIL ETF: Cambria Tail Risk ETF. The following “Return Stacking” performance is the hypothetical combination of live indice performance. Return Stacking BTOP50 + S&P 500: 100% exposure to each index, rebalanced quarterly. Return Stacking SG Trend + S&P 500: 100% exposure to each index, rebalanced quarterly. See important disclaimers at end for more. Source: Bloomberg and Auspice Investment Operations. You cannot invest directly in an index. Indexes are gross of fees. Past results are not necessarily indicative of future results.
For investors seeking a diversified and performance-seeking portfolio, consider the following implications:
Tail Hedge strategies historically have delivered strong negative equity correlations but are impractical for most investors due to negative long-term returns. There are multiple live performance CTA indexes with almost 40 years of history – there are no such tail hedge indexes due to a lack of success with tail hedge strategies.
CTA Trend Following (BTOP50 CTA and SG Trend Indexes), with zero to negative equity correlation, has been the largest source of diversification for many institutional investors, often in “Crisis Risk Offset (CRO)” or “Risk-Mitigating Strategies (RMS)” portfolios. The retail uptake, however, has been lesser given performance may be lower than other solutions with higher equity correlations.
Long Term US Treasuries historically have provided a strong complement to equities, and this is why they typically are the second largest component in CRO and RMS portfolios - albeit they have been less effective in inflationary environments.
Return Stacking, while higher equity correlations versus pure CTA exposure, has lower S&P 500 correlations versus a traditional 60/40 portfolio alongside significantly higher returns – outside of the spectrum of other public markets strategies.
Return Stacking with pure trend CTAs (as represented by the SG Trend Index) is a stronger complement to equity beta versus multi-strategy CTAs (as represented by the BTOP50 CTA) that typically have higher equity correlations. See index definition at the end for more on this.
This is what we have built in the Auspice One Fund. For every dollar invested in the Auspice One Fund, you get approximately:
$1 exposure of the Auspice Diversified (trend-following, flagship CTA), and
$1 exposure of the S&P 500.
Two for one.
The Auspice One Fund delivers institutional-style diversification and performance in a single, cash-efficient solution – without stacking the risk.
Institutions like Ontario Teachers’ Pension Plan (OTPP) and Delta Airlines Pension Plan have used portable alpha for decades. Return stacking brings this institutional innovation to public investors – for the first time at scale.
Why Now? Metals momentum is building. Trend strategies are gaining traction. The Auspice One Fund is designed for this environment.
The diversification trade-off no longer needs to be accepted as a given. With markets shifting and structural trends emerging across commodities and equities, strategies like the Auspice One Fund may offer a timely solution. For additional information, the Auspice team is available to share more insights.
Note: Long-term commodity returns are higher than the period commencing 2000 and may also represent a unique opportunity for diversification and equity-like returns. As an example, from January 1st, 1960, to May 31st, 2025, the BCOM TR annualized 7.7% with just a 0.13 S&P 500 correlation.
DEFINITIONS
Indices
Indices and benchmarks are used for comparison purposes only or to illustrate comparisons against other widely used indices or benchmarks most commonly referenced by investors. Index statistics/data are sourced from Bloomberg. You cannot invest directly in an index.
The Bloomberg Commodity Index Total Return (BCOM TR) Index is a broadly diversified commodity price index that tracks prices of futures contracts on physical commodities on the commodity markets. No one commodity can compose more than 15% of the BCOM ER index, no one commodity and its derived commodities can compose more than 25% of the index, and no sector can represent more than 33% of the index.
S&P GSCI Total Return Index (GSCI TR) – A production-weighted commodity index covering a broad range of raw materials, including energy (crude oil, natural gas, gasoline, heating oil), metals (gold, silver, aluminum, copper, lead, nickel, zinc), agriculture (wheat, corn, soybeans, cotton, coffee, sugar, cocoa), and livestock (live cattle, feeder cattle, lean hogs). Its weighting heavily favors energy, making it sensitive to crude oil price movements.
BTOP50 Index (Barclay CTA Index): The BTOP50 CTA Index is a live performance benchmark for managed futures programs, specifically tracking the performance of the 20 largest Commodity Trading Advisors (CTAs). It is constructed and maintained by Barclay Hedge and aims to reflect the representative performance of active CTA managers. Historically, approximately 40–60% of the BTOP50 index has been made up of pure trend-following strategies, depending on the year and manager composition. The remainder (40–60%) includes multi-strategy CTAs, which blend trend with other strategies such as: mean reversion, carry/arbitrage, short volatility, machine learning and predictive models, and risk premia or macro overlays.
SG Trend Index (Societe Generale Trend Index) – The SG Trend Index is designed to track the performance of the largest trend-following Commodity Trading Advisors (CTAs) that are open to new investment. It includes 10 managers selected based on assets under management and correlation characteristics, with performance data collected monthly. The index is equally weighted and rebalanced annually, providing a benchmark for systematic, directional managed futures strategies focused on capturing medium- to long-term trends across asset classes including commodities, currencies, fixed income, and equities.
Equity Hedge (CBOE S&P 500 5% Put Protection Index, PPUT) – The CBOE S&P 500 5% Put Protection Index represents a hedged equity strategy that holds a long position in the S&P 500 Index while continuously purchasing 5% out-of-the-money (OTM) put options on a monthly basis. This strategy seeks to provide downside protection while maintaining equity market exposure. It reflects the cost and performance drag of systematic tail hedging through puts.
TSX 60 Equity Total Return Index (TSX 60 TR) – A total return equity index representing the performance of 60 large-cap Canadian stocks, comprising the S&P/TSX 60 Index. The total return version includes price appreciation as well as reinvested dividends, and is often used as a benchmark for Canadian equity exposure.
Bloomberg Barclays US Corporate High Yield Total Return Index – A market-value-weighted index measuring the performance of U.S. dollar-denominated, non-investment-grade (high-yield) corporate bonds. The index includes publicly issued debt from U.S. and non-U.S. corporations and reflects both income and capital appreciation.
MSCI Emerging Markets Net Total Return Index (MSCI EM TR) – A broad equity index that captures the performance of large- and mid-cap companies across 24 emerging market countries. The net total return version includes the effect of dividend reinvestment after the deduction of withholding tax based on the country of the issuer.
Bloomberg Barclays US Aggregate Bond Total Return Index (Barclays Agg) – A broad-based benchmark tracking the performance of the U.S. investment-grade bond market, including Treasuries, government-related and corporate securities, mortgage-backed and asset-backed securities. The total return version accounts for price movement and interest income.
Bloomberg US Treasury Bills Total Return Index (Cash) – A benchmark measuring the total return performance of U.S. Treasury bills with maturities of 1–3 months. It is often used to represent a risk-free rate or cash-equivalent investment.
Bloomberg Barclays US Treasury 20+ Year Total Return Index (Long Term Treasuries) – This index tracks the performance of U.S. Treasury bonds with maturities of 20 years or more. It is commonly used to represent the long-duration segment of the fixed income market and is highly sensitive to interest rate movements.
Cambria Tail Risk ETF (TAIL ETF) – The Cambria Tail Risk ETF is a rules-based ETF designed to hedge against significant equity market drawdowns. The fund invests approximately 90% in short-term U.S. Treasuries and 10% in long S&P 500 put options, aiming to provide downside protection while minimizing cost drag in normal markets.
IMPORTANT DISCLAIMERS AND NOTES
There is a substantial risk of loss in trading futures and options. Past performance is not necessarily indicative of future results.
The hypothetical performance shown is not actual performance. Hypothetical performance has inherent limitations and does not represent actual trading. No representation is being made that any account will or is likely to achieve performance results similar to those shown within this chart. The results are based on simulated or historical data, not actual trading. The hypothetical performance shown does not reflect the deduction of advisory fees, trading commissions or other expenses that would be incurred in an actual account. Other factors, such as market impact, may adversely affect the actual trading results.
Commissions, trailing commissions, management fees and expenses may all be associated with investment funds. Please read the prospectus or applicable offering document before investing. Investment funds are not guaranteed, their values change frequently and past performance may not be repeated.
These materials are provided for informational and educational purposes and are not intended to provide specific individual advice including, without limitation, investment, financial, legal, accounting and tax. Please consult with your own professional advisor on your particular circumstances.
Futures trading is speculative and is not suitable for all customers. Past results are not necessarily indicative of future results. This document is for information purposes only and should not be construed as an offer, recommendation or solicitation to conclude a transaction and should not be treated as giving investment advice. Auspice Capital Advisors Ltd. (the “Manager” or “Auspice”) makes no representation or warranty relating to any information herein, which is derived from independent sources. No securities regulatory authority has expressed an opinion about the securities offered herein and it is an offence to claim otherwise. Please read the applicable offering documents before investing.
This material may contain forward-looking statements, which were prepared for the purpose of providing general educational background information and may not be appropriate for other purposes. Certain statements in this document are forward- looking statements, including those identified by the expressions “anticipate”, “believe”, “plan”, “estimate”, “expect”, “intend”, “target”, “seek”, “will” and similar expressions to the extent they relate to an Auspice managed investment fund (the “Fund”), where applicable, and the Manager. Forward- looking statements are not purely historical facts but reflect the current expectations of the Fund, where applicable, and the Manager regarding future results or events. Such forward-looking statements reflect the Fund’s, where applicable, and the Manager’s current, reasonable beliefs and are based on information currently available to them. Forward-looking statements are made with assumptions and involve significant risks and uncertainties. Although the forward-looking statements contained in this document are based upon assumptions that the Fund, where applicable, and the Manager believe to be reasonable, neither the Fund, where applicable, or the Manager can assure investors that actual results will be consistent with these forward-looking statements. There is no guarantee that any forward-looking statement will come to pass. As a result, readers are cautioned not to place undue reliance on these statements as a number of factors could cause actual results or events to differ materially from current expectations.
Neither the Fund, where applicable, nor the Manager assumes any obligation to update or revise any forward-looking statement to reflect new events or circumstances, except as required by law.
The Manager may present the enclosed information a blog – such blog may contain hypertext links to web sites owned and controlled by parties other than Auspice. We have no control over any third-party-owned web sites or content referred to, accessed by or available on such web site and therefore we do not endorse, sponsor, recommend or otherwise accept any responsibility for such third-party web sites or content or for the availability of such web sites. In particular, we do not accept any liability arising out of any allegation that any third-party-owned content (whether published on this or any other web site) infringes the intellectual property rights of any person, or any liability arising out of any information or opinion contained on such third-party web site or content.
[1] Less liquid private market strategies can provide high returns and low correlation but sacrifice liquidity.