
Source: Auspice
The last decade was arguably the decade of the traditional portfolio. A secular bull market in bonds alongside quantitative easing and the lowest inflation in history produced stellar performance for the 60/40 portfolio.
The diversification from bonds was also somewhat atypical. The recent positive correlation in 2022 is more consistent with the longer-term equity-bond correlation, particularly in inflationary periods such as the three decades leading into this century (ie 1970-2000); a detriment to investors relying on this fluid relationship for much needed diversification.

Source: Bloomberg and https://www.pennmutualam.com/market-insights-news/blogs/chart-of-the-week/2022-06-23-more-pain-ahead-for-the-60-40-portfolio
Worse, with inflation surging and volatility elevated it is possible the 2020s could produce another “Lost Decade” for the 60/40 portfolio, as experienced 2000-2009.

Source: Goldman Sachs Asset Management and Bloomberg, https://www.gsam.com/content/gsam/us/en/advisors/market-insights/gsam-connect/2021/is-the-60-40-dead.html
As we know, there are many options to diversify beyond stocks and bonds – something more capable, larger institutional investors have long embraced. With Quantitative Easing (QE) over and inflation sinking it, most investors are re-evaluating portfolios if not already done.
Some pensions like Ontario Teachers’ (OTPP) and Hawaii (HIERS) are ahead of the game and have announced exceptional results, delivering 1.2% and -1.7% in the first half performance, far superior to the traditional 60/40 portfolio result of -16.3%.
What are the pensions and endowments doing exactly? How are they performing?
This month we look at five of the best.
Endowments
Yale
Yale and its “Endowment Model” has long been recognized for its innovation and outperformance.
“The University's 20-year market-leading return of 11.3 percent per annum produced $30.6 billion in relative value. Over the past 30 years, Yale's investments have returned an unparalleled 13.6 percent per annum, adding $47.0 billion in value relative to the Cambridge mean(1).”
Whereas in 1990 public equity and fixed income represented 85% of the portfolio, today that number is less than 30%, with Absolute Return, Venture Capital, and Leveraged Buyouts representing the bulk of assets. 1H 2022 performance isn’t public yet for the endowment, but given the asset class allocation, we expect it to be little phased by public market weakness.

Source: https://investments.yale.edu/
Harvard Management Company (HMC)
Harvard, like Yale, has long moved away from a 60/40 portfolio. Notably, as of their most recent update, HMC has less than 20% of their entire portfolio in public equity and fixed income. Importantly, one third of the portfolio is in hedge funds, and one third in private equity.

Source: https://www.hmc.harvard.edu/wp-content/uploads/2021/10/FY21_HMC_Annual_Report.pdf
Pensions
The endowment and foundations tend to have the most autonomy and ability to build truly diversified portfolios. Not far behind the endowments and foundations are the Canadian pensions which are some of the most highly regarded pensions in the world. Unlike their US counterparts, most of the Canadian pensions have complete independence from government and politics, whereas the US pensions often must work underneath never-ending political influences that ultimately weigh into investment decisions and weigh onto performance.
Ontario Teachers’ Pension Plan (OTPP)
Ontario Teachers has delivered some of the strongest returns with an impressive 1.2% H1 2022 net return, one year return of 8.3%, and a ten-year annualized 9.0%. Moreover, as we examine this top performing portfolio, the edge largely comes from Inflation Sensitive, half of which is in Commodities, and Absolute Return (i.e. hedge funds like CTAs). Notably, 28% of the portfolio is in Inflation Sensitive and Absolute Return asset classes.
“Our diversified portfolio performed well and as designed, delivering positive returns despite a highly inflationary environment that saw losses in most major stock and bond indices. We saw positive returns in our inflation-sensitive, infrastructure and absolute return strategies asset classes, which were partially offset by losses in public equities, venture growth and credit(2)”

Source: Auspice and https://www.otpp.com/en-ca/about-us/news-and-insights/2022/ontario-teachers--delivers-positive-return-in-first-half-of-2022/
Employees’ Retirement System of Hawaii (HIERS)
In the US, despite not having the same independence as their Canadian pension counterparts, some US pensions have stood out from the pack with truly diversified portfolios. Hawaii is one of such plans with all-star leadership from former CIO Elizabeth Burton and current acting CIO Howard Hodel.
HIERS produced a -1.66% H1 2022 result with “Liquid Defensive” (trend-following) buoying the portfolio, +18.54% YTD. Notably liquid defensive represents 13.9% of the $22bn diversified portfolio.
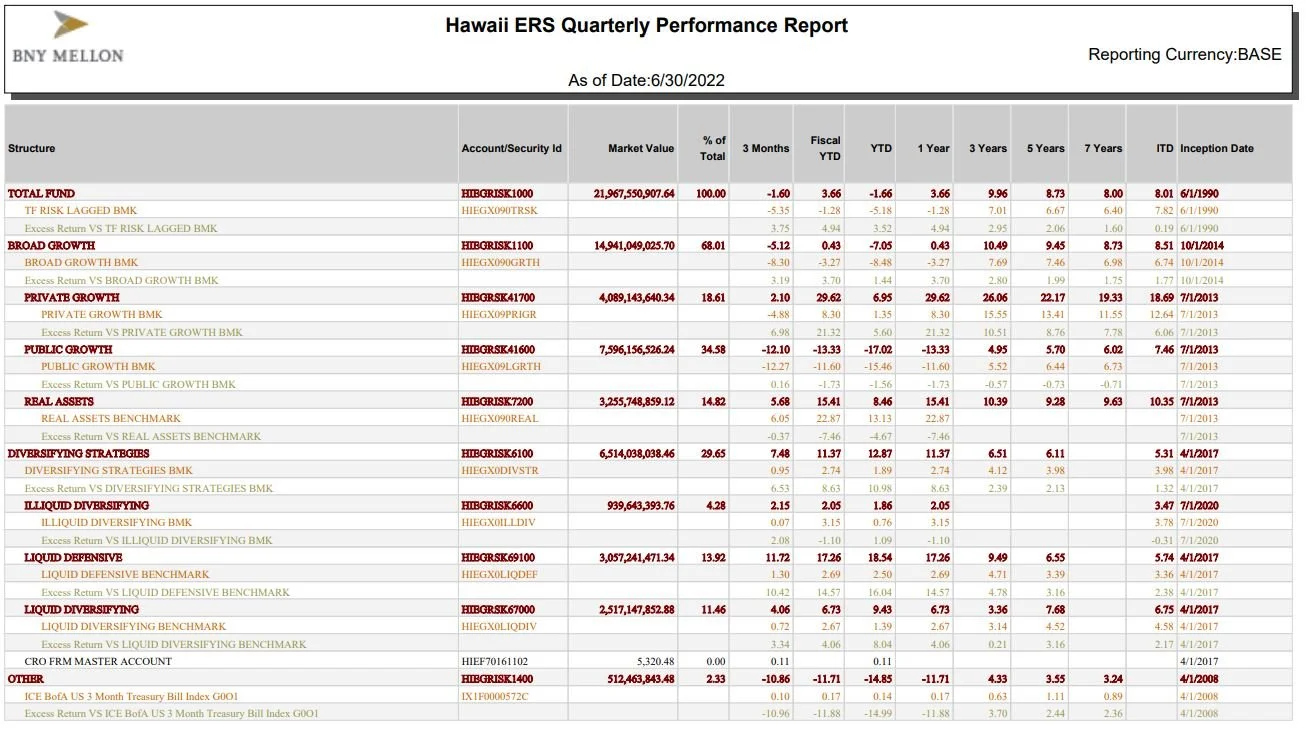
Source: https://ers.ehawaii.gov/wp-content/uploads/2022/09/2022-Q2-HIERS-Risk-Performance.pdf
California State Teachers’ Retirement System (CalSTRS)
CalSTRS is the largest educator-only pension fund in the world with $312 billion as of July 31, 2022. While it didn’t quite keep up with HIERS & OTPP, its -7.9% H1 2022 result was still well ahead of benchmarks, and the large public plan has delivered an impressive 9.4% 10-year net return as of June 30th, 2022 – a notable result particularly given the 2022 public market sell off.

Source: https://www.calstrs.com/files/62518ad5d/semi062022P+-+CIO.pdf
Its Risk Mitigating Strategies (“RMS”) portfolio has delivered strong performance in the face of public market weakness. CalSTRS is one if the biggest investors in trend Following with $17.5bn (5.8% of total portfolio) invested in six trend-following CTAs.

Source: https://www.calstrs.com/files/a4858f8de/semi062022P+-+RMS.pdf
In contrast, CalPERS (California Public Employees’ Retirement System), the larger of the two California plans ($440bn), has long suffered from political interference and has been hamstrung by an inability to effectively integrate diversifying alternatives. The 10-year return for CalPERS was 7.7%, 160bps and tens of billions of dollars below CalSTRS(3,4). This should come as no surprise given the greater than 70% allocation to public equity and fixed income, with an obvious hole in the portfolio around uncorrelated diversifying strategies.

“New Asset Mix” as of July 2022. Source: https://www.calpers.ca.gov/page/newsroom/calpers-news/2021/calpers-board-new-asset-allocation-keeps-discount-rate-at-six-point-eight-percent
Final Thought
It took over a decade of raising rates to combat inflation during the last inflationary surge in the 1970s. Returns over this period, as demonstrated below, were significantly lower than what was experienced last decade (2010-2020).

Source: https://ofdollarsanddata.com/ray-dalio-all-weather-portfolio/
In Auspice’s opinion, we are early days in this new cycle. Leading institutions have made significant improvements to their portfolios away from the traditional 60/40 allocation.
Your portfolio probably should be different, too.
For information about the Auspice product suite and how we can help, email us today at info@auspicecapital.com.
References
Sources
Yale
Harvard
OTPP
Hawaii
https://ers.ehawaii.gov/wp-content/uploads/2022/09/2022-Q2-HIERS-Managers-and-AUM.pdf
https://ers.ehawaii.gov/wp-content/uploads/2021/07/HIERS-IPS-June-2021.pdf
CalSTRS
https://www.calstrs.com/files/5f5c5d074/semi062022P+-+IS.pdf
https://www.calstrs.com/files/a4858f8de/semi062022P+-+RMS.pdf
Disclaimer below
IMPORTANT DISCLAIMERS AND NOTES
1. The S&P 500 is an index of 500 stocks chosen for market size, liquidity and industry grouping, among other factors. The S&P 500 is designed to be a leading indicator of U.S. equities and is meant to reflect the risk/return characteristics of the large cap universe. Price Return data is used (not including dividends).
2. The (MSCI) World Index, Morgan Stanley Capital International, is designed to measure equity market performance large and mid-cap equity performance across 23 developed markets countries, covering approximately 85% of the free float-adjusted market capitalization in each. This index offers a broad global equity benchmark, without emerging markets exposure.
3. The S&P Goldman Sachs Commodity Excess Return Index (GSCI TR), is a composite index of commodity sector returns representing an unleveraged, long-only investment in commodity futures that is broadly diversified across the spectrum of commodities. The GSCI Total Return (“TR”) Index includes the return on cash collateral.
Futures trading is speculative and is not suitable for all customers. Past results are not necessarily indicative of future results. This document is for information purposes only and should not be construed as an offer, recommendation or solicitation to conclude a transaction and should not be treated as giving investment advice. Auspice Capital Advisors Ltd. makes no representation or warranty relating to any information herein, which is derived from independent sources. No securities regulatory authority has expressed an opinion about the securities offered herein and it is an offence to claim otherwise.
QUALIFIED INVESTORS
For U.S. investors, any reference to the Auspice Diversified Strategy or Program, “ADP”, is only available to Qualified Eligible Persons “QEP’s” as defined by CFTC Regulation 4.7.
For Canadian investors, any reference to the Auspice Diversified Strategy or Program, “ADP”, or Auspice One Fund “AOF”, is only available to “Accredited Investors” as defined by CSA NI 45-106.