Unlike most broad and single commodity ETFs that are trading vehicles, all Auspice strategies are designed to be portfolio solutions part of an asset allocation process. Broad and single commodity ETFs typically have high volatility and drawdown whereas Auspice manages the risk and targets a 10-12% volatility in all our solutions.
As such, timing an allocation generally should be focused on long-term strategic asset allocation vs shorter-term tactical goals. If you think we’ll be in an inflationary environment for some time (something Auspice strongly believes), an overweight to tactical commodity strategies is likely ideal. If you think we’re returning to a Quantitative Easing environment with record low inflation, interest rates, and volatility, perhaps sticking with a traditional portfolio is warranted.
That said, as the Auspice Broad Commodity Index (underlying strategy to NYSE “COM” and TSX “CCOM” ETFs) went to a 100% cash position in October we performed some analysis. To some, buying a “commodity” ETF that is currently 100% cash seems counterintuitive. Historically this has only occurred three times since 2000. In September 2014 this occurred and there was significant outperformance vs long only commodity benchmarks (2-year 43.78% cumulative outperformance ABCERI vs S&P GSCI ER). In September 2008 and March 2020, the performance following was amongst the strongest performing periods. See case studies below.
Summary: The Current Opportunity
Limited Downside – In October the strategy went flat 12/12 commodities
Opportunistic Upside - Systematically adding positions as new long trends re-emerge on an individual market basis
Cash Yield - COM & CCOM average 90% cash position (today 100%), now generating a meaningful yield
With the Auspice Broad Commodity Index (ABCERI) exiting its last position in October there effectively is no downside risk at this moment. All twelve of the underlying commodities are without a defined uptrend and the strategy is tactically sitting in cash. Some positions, like Gold and Silver, were exited many months ago, and some, like Natural Gas, were more recently removed.
In terms of upside opportunity, Corn is showing the greatest signs of strength, and metals broadly look like they may be bottoming, but none have yet to meet our criteria. As 2020 highlighted however, things can change quickly making this hard to time across a diverse basket of unique commodity opportunities.
March 2020
The Auspice Broad Commodity Index finished 2019 long 7/12 commodities and in January 2020 Heating Oil was added for a total of 8/12 positions. Shortly after, COVID began weighing on markets and by the end of February we had cut risk significantly, finishing long just 4/12 commodities. As March progressed, we exited all remaining positions and were 100% cash – the same position the Auspice Broad Commodity Index finished October 2022. This downside risk management led to significant outperformance is 2020 and a positive result versus benchmark indices. See Chart 1 below.
Chart 1: 2020 Case Study, ABCERI vs Benchmark Commodity Indexes

Positions began to be added back in the months following and in September the strategy was already long 11/12 positions. If you invested in the COM ETF at the end of March 2020 when COM went to cash you received a 18.97% return in 2020 and a +21% annualized / 64% cumulative return through October 2022 on 11% vol and a max 8% drawdown.
September 2008
The Auspice Broad Commodity Index (ABCERI) went 100% cash in September 2008 as the global financial crisis set in. The rebound in commodities in this case took longer, however Auspice Broad Commodity tactically sitting in cash proved highly strategic as commodity and equity markets faced continued fierce selling in the months following. See Chart 2 below.
Chart 2: ABCERI Cash Position in 2008 and Outperformance Following
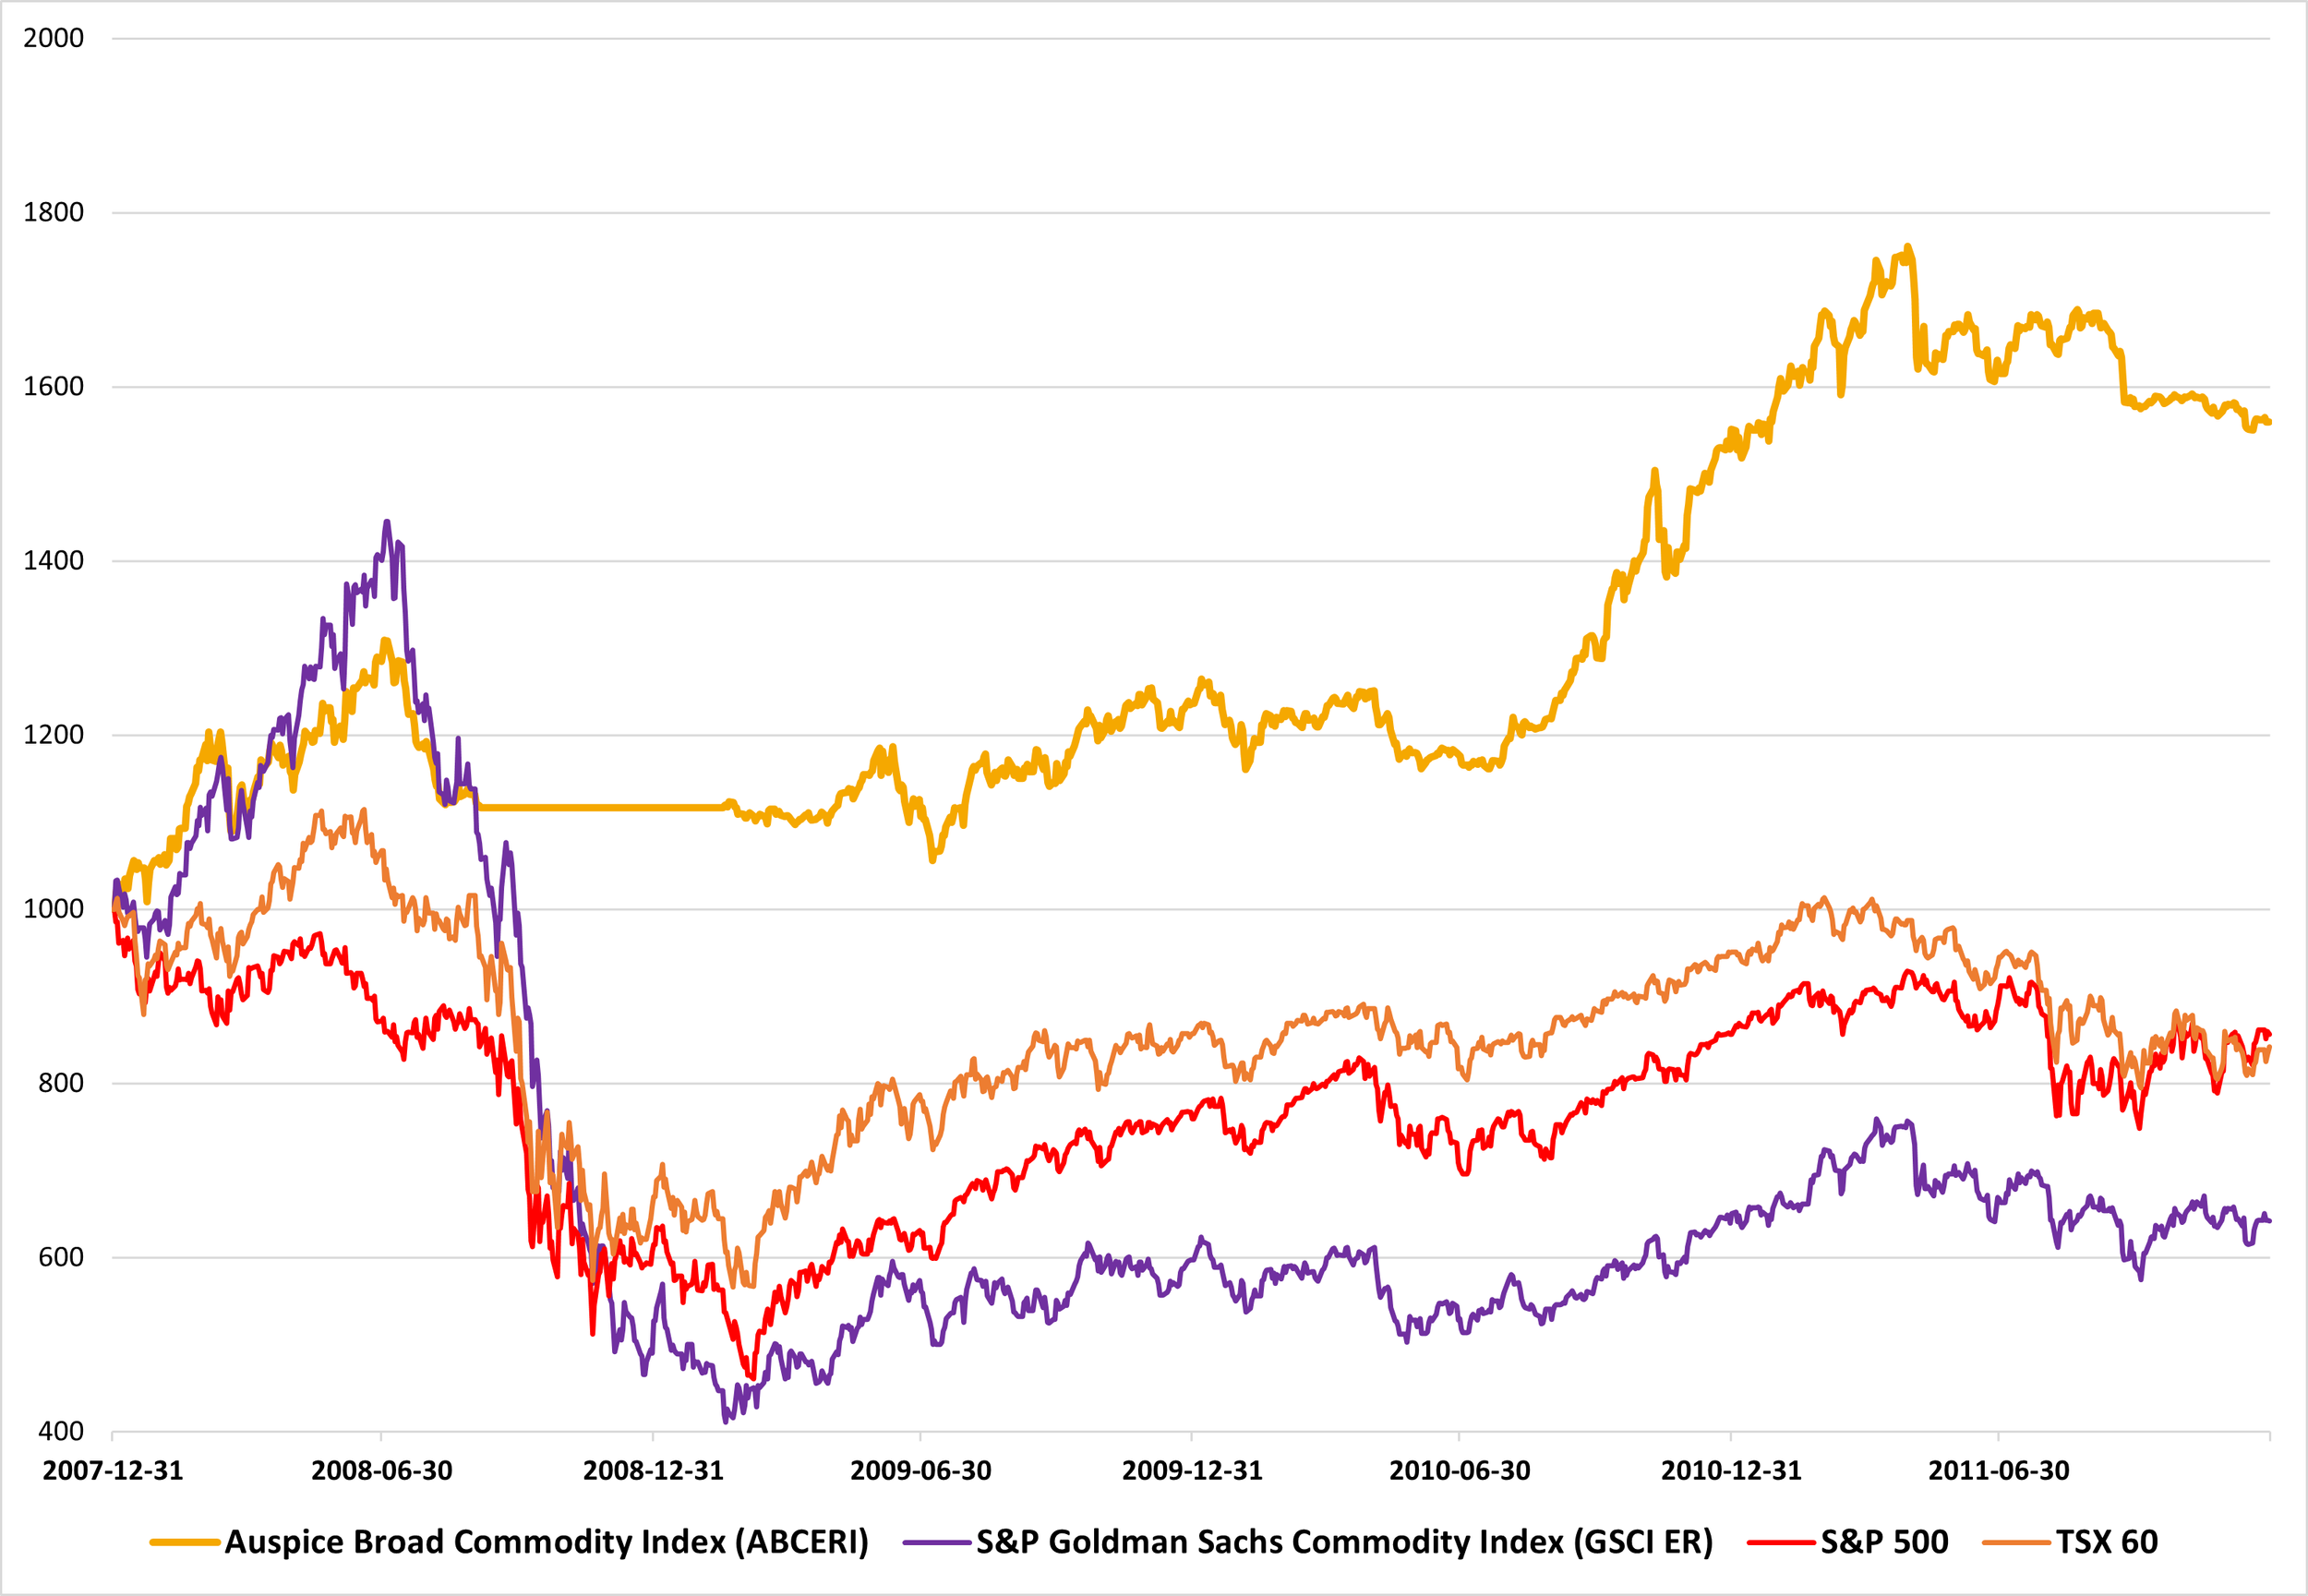
Following the September 2008 move to 100% cash the Auspice Broad Commodity Index generated a 3yr +12.19% annualized (41.18% cumulative) return. The outperformance versus commodity and equity benchmarks, as indicated above, was significant.
Further, the underlying Index (ABCERI) doesn’t include a cash return, something that has recently become significant in both the COM and CCOM ETFs.
The “New” Cash Return (Important!)
One feature of futures backed commodity ETFs (and funds such as our flagship Auspice Diversified) is that they are extremely cash efficient. For both Auspice Broad Commodity and Auspice Diversified we average less than 7% margin to equity. In plain English this means for every $100 you invest we generally need less than $10 to put on the futures positions, and the other $90 sits in cash.
Today, with no positions in commodities, the COM and CCOM ETFs are 100% cash. In the CCOM ETF, for every $100 invested, $100 is invested in the CI Money Market Fund (CIG 872) that is generating a near 4% yield.
The cash return, until recently, was not overly relevant as rates were near zero. Today, it is meaningful and a unique feature of futures backed ETFs and funds and makes this a great place to park cash and wait for opportunity.
Summary
For several reasons (see August Blog for more) we think this is the first pullback in the longer-term super cycle and thus a great potential entry point. The post COVID run up was significant in the shorter term but rather insignificant in the longer-term perspective.
For context, from trough to peak (May 2020 through June 2022) the long-standing benchmark GSCI TR Commodity Index generated a 179% return. In the 1970s the GSCI TR generated a 587% cumulative return. There were many pullbacks during this period, and we believe we are currently in a similar shorter term down-trend within a long-term uptrend.
It’s also important to revisit the long-term perspective and not get caught up in short-term noise. Commodities have outperformed global equities (MSCI World below) over the long run, and we’re potentially in the early innings of the next super cycle. See Chart 3 below.
Chart 3: Long Term Stock and Commodity Returns.

Disclaimer below
IMPORTANT DISCLAIMERS AND NOTES
1. The S&P 500 is an index of 500 stocks chosen for market size, liquidity and industry grouping, among other factors. The S&P 500 is designed to be a leading indicator of U.S. equities and is meant to reflect the risk/return characteristics of the large cap universe. Price Return data is used (not including dividends).
2. The (MSCI) World Index, Morgan Stanley Capital International, is designed to measure equity market performance large and mid-cap equity performance across 23 developed markets countries, covering approximately 85% of the free float-adjusted market capitalization in each. This index offers a broad global equity benchmark, without emerging markets exposure.
3. The S&P/TSX 60 Index is a stock market index of 60 large companies listed on the Toronto Stock Exchange. Maintained by the Canadian S&P Index Committee, a unit of Standard & Poor's, it exposes the investor to nine industry sectors. Combined with the S&P/TSX Completion Index it forms the S&P/TSX Composite Index.
4. The S&P Goldman Sachs Commodity Excess Return Index (GSCI TR), is a composite index of commodity sector returns representing an unleveraged, long-only investment in commodity futures that is broadly diversified across the spectrum of commodities. The GSCI Total Return (“TR”) Index includes the return on cash collateral.
5. The Bloomberg Commodity (Excess Return) Index (BCOM ER), is a broadly diversified index that allows investors to track 19 commodity futures through a single, simple measure. Excess Return (ER) Indexes do not include collateral return whereas Total Return (TR) indexes include collateral return.
6. The Auspice Broad Commodity strategy combines opportunistic commodity exposure with capital preservation. Returns for Auspice Broad Commodity Excess Return Index or “ABCERI” represent returns calculated and published by the NYSE. ABCERI index calculated and published by NYSE since Sep. 2010. Returns prior as published by the NYSE are considered hypothetical. The index does not have commissions, management/incentive fees or operating expenses. The Auspice Broad Commodity Excess Return (“ER”) Index does not include the return on cash collateral.
Futures trading is speculative and is not suitable for all customers. Past results are not necessarily indicative of future results. This document is for information purposes only and should not be construed as an offer, recommendation or solicitation to conclude a transaction and should not be treated as giving investment advice. Auspice Capital Advisors Ltd. makes no representation or warranty relating to any information herein, which is derived from independent sources. No securities regulatory authority has expressed an opinion about the securities offered herein and it is an offence to claim otherwise.
QUALIFIED INVESTORS
For U.S. investors, any reference to the Auspice Diversified Strategy or Program, “ADP”, is only available to Qualified Eligible Persons “QEP’s” as defined by CFTC Regulation 4.7.
For Canadian investors, any reference to the Auspice Diversified Strategy or Program, “ADP”, or Auspice One Fund “AOF”, is only available to “Accredited Investors” as defined by CSA NI 45-106.