Publication Date: June 2nd 2023
Choose your Commodity Exposure Wisely.
In last month's blog “Agflation” we highlighted a number of commodity staples markets breaking out to 10+ year highs. At the same time, in the last twelve months (through May 31st, 2023), commodities have been in a retracement (yellow circles in Chart 1 and 2) after a strong two-year rally. The long only commodity benchmark indexes BCOM & GSCI have experienced 28% and 31% peak to trough drawdowns respectively (the tactical Auspice Broad Commodity Index has mitigated most of this drawdown and is down just 5% over this one-year period).
Chart 1: Performance of Long Standing GSCI Commodity Benchmark Since 1970
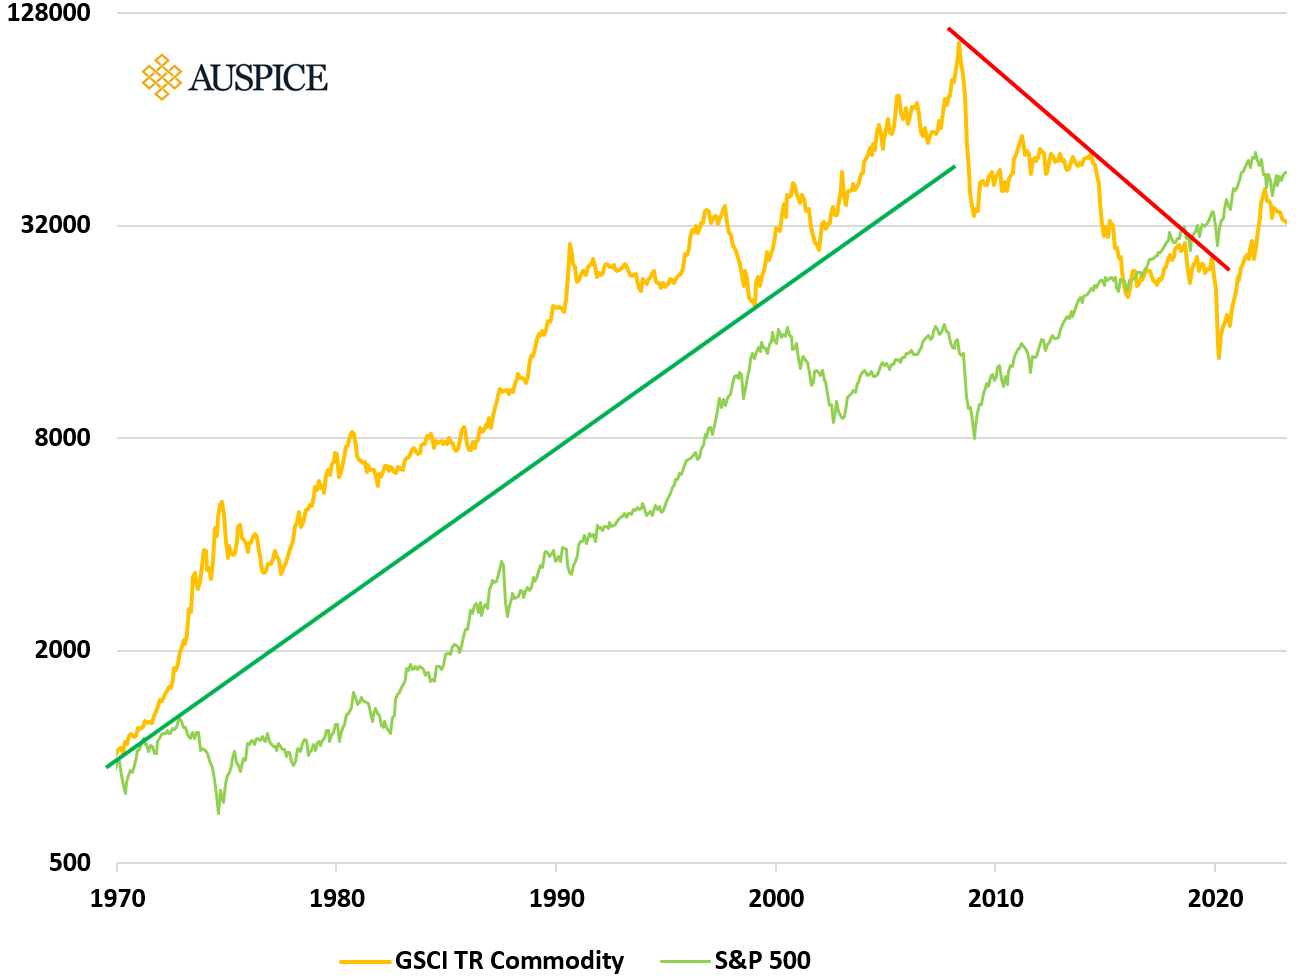
Source: Auspice Capital Advisors and Bloomberg, as at May 31st 2023. You cannot invest directly into an index. See index definitions at the end. Past performance is not indicative of future results.
Chart 2: Performance of More Diversified Broad Commodity Benchmarks BCOM & ABC Since 2000
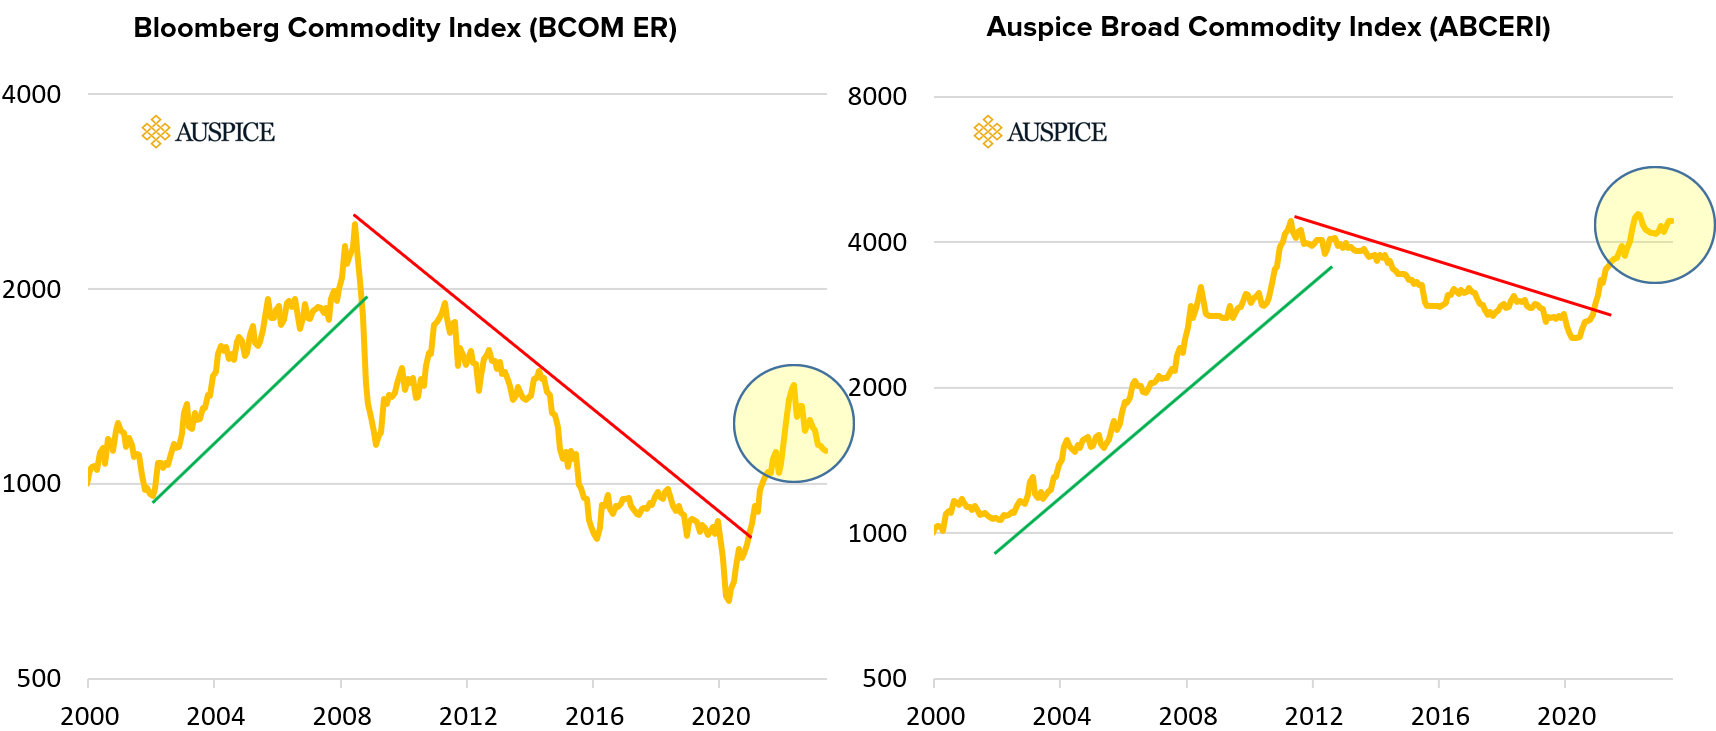
Source: Auspice Capital Advisors and Bloomberg, as at May 31st 2023. You cannot invest directly into an index. See index definitions at the end. The performance of Auspice Broad Commodity Index prior to 9/30/2010 represents index data simulated prior to third party publishing as calculated by the NYSE. Past performance is not indicative of future results.
We are bullish long term on commodities for many reasons (more here and here). That being said, like all markets, commodities in particular, do not go straight up. Risk management is critical. Importantly, there is a marked difference between resource equities, traditional long-only commodities, and tactical commodity strategies such as those Auspice offers.
Beginning in the second half of 2020 investors started to allocate to commodities for the first time in many years. Whether investing through resource equities, traditional long only direct commodity exposure, or more tactical strategies such as those Auspice offers, investors generally had a positive experience.
Many benefited from the high risk levels of some strategies on the upside, but more recently have been reminded of the risk on the downside (see example, here). The recent 31% peak to trough drawdown of the GSCI, while significant, is still but a fraction of the most recent Q1 2020 correction (-53%) and the bear market of last decade (-89%).
Further, risk is often overly simplified and defined by “volatility” or “maximum drawdown”. Good starting points, these metrics miss arguably one of the most important “risk” considerations in our opinion; correlation. The classic Warren Buffet quote summarizes it best, that “Diversification is the only free lunch in investing”.
Risk: Resource Equity vs Long Only Commodity vs Tactical Commodity
Consider a brief analysis of “risk” within typical solutions; two leading long only broad commodity benchmarks, two leading resource equity benchmarks, and two Auspice solutions, as per below:
Bloomberg Commodity Index Excess Return (“BCOM ER”)
S&P Goldman Sachs Commodity Index Excess Return (“SP GSCI ER”)
MSCI World Commodity Producers Index (“MSCI WCPI”)
S&P/TSX Capped Energy Index (“TSX Cap Energy”)
Auspice Diversified Trust
Direxion Auspice Broad Commodity ETF (“COM”)
Table 1: Commodity Performance January 1st 2020 to May 31st 2023
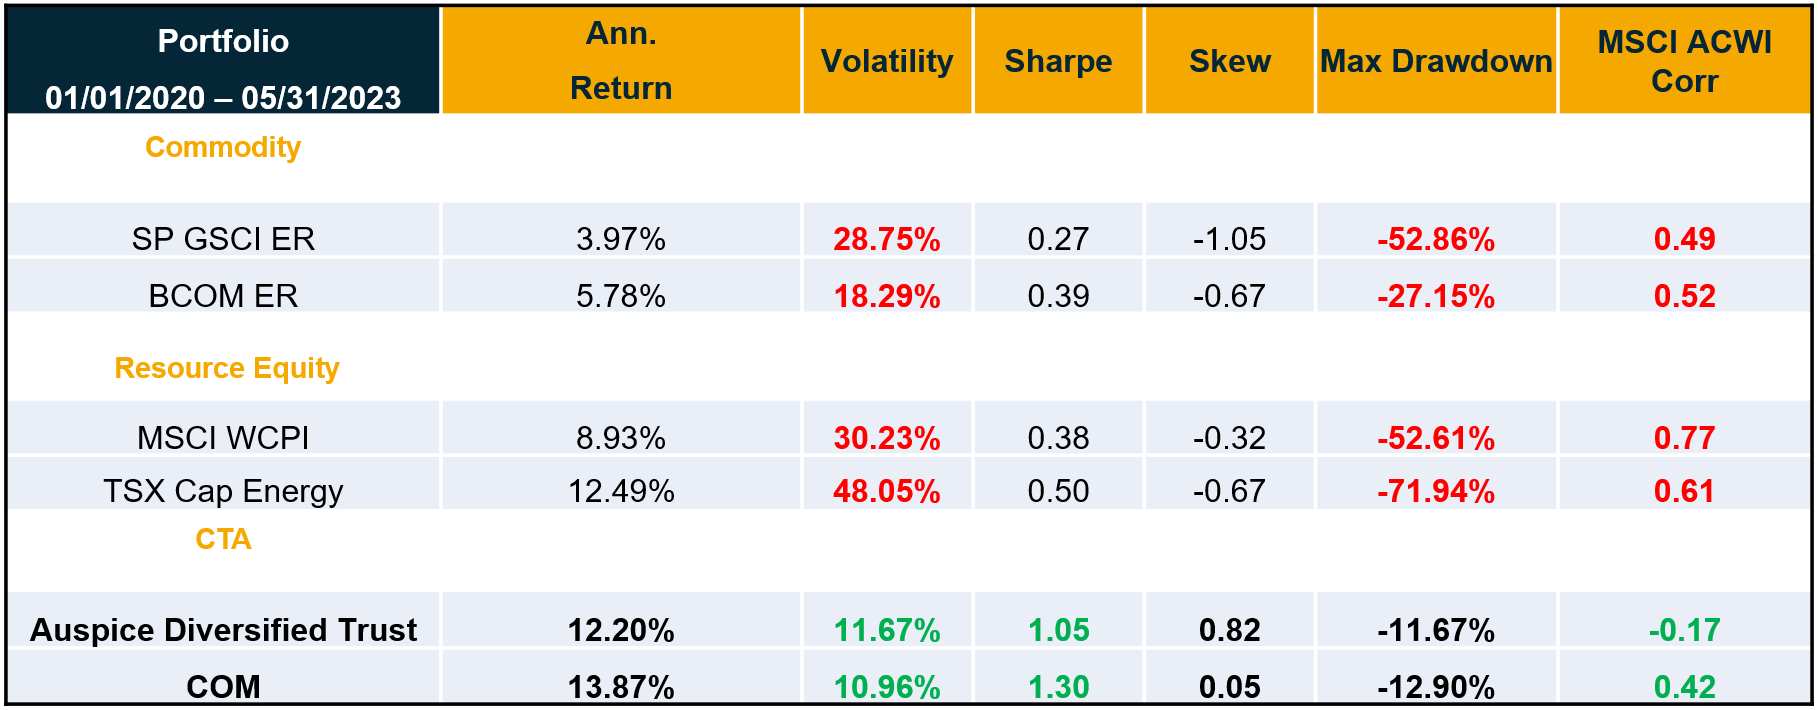
Source: Auspice Capital Advisors and Bloomberg, as at May 31st 2023. The returns for Auspice Diversified Trust are net of fees. Returns represent the performance for Auspice Diversified Trust, Series X. You cannot invest directly into an index. See index definitions and further disclaimers at the end. Past performance is not indicative of future results.
We believe managing risk is job #1 with commodities. Unless one has impeccable timing, the high volatility and drawdown of traditional passive strategies, whether they be Commodity long-only or Resource Equity, make most solutions untenable for investors in our opinion.
While commodities have provided equity like returns since 2020, consistent with long-term commodity performance (see Chart 1), it has been a bumpy road for traditional commodity and resource equity investors. The diversification benefit of many solutions, with equity correlations greater than 0.5 (see table 1), are negligible. This was highlighted in Q1 2020 when many “diversifying” commodity solutions extended portfolios losses, rather than providing offsetting, diversifying returns at a critical time.
Chart 3: Performance of Commodity Products Q1 2020
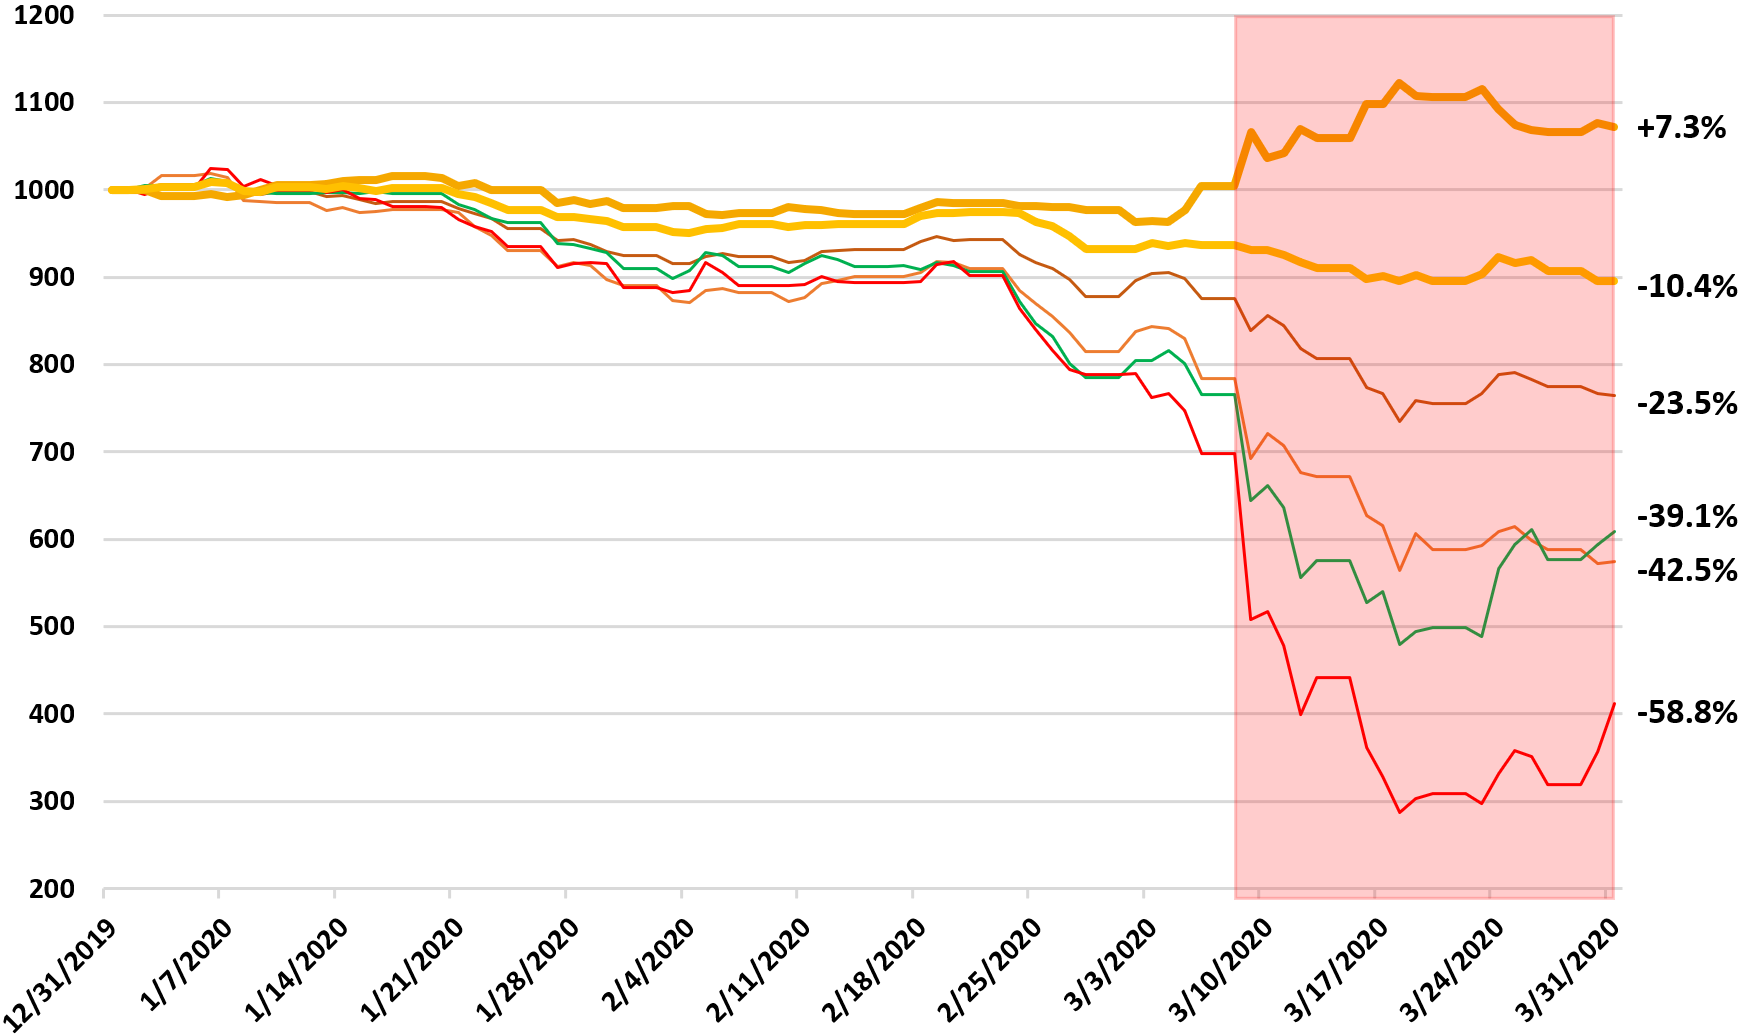
Source: Auspice Capital Advisors and Bloomberg, as at May 31st 2023. The returns for Auspice Diversified Trust are net of fees. Returns represent the performance for Auspice Diversified Trust, Series X. You cannot invest directly into an index. See index definitions and further disclaimers at the end. Past performance is not indicative of future results.
Asset Allocation – Opportune time to buy the dip?
Looking forward, broadly we see two environments being forecasted:
Recession and/or continued inflation/stagflation
Expansion and disinflation
We do not have a crystal ball. What we do know is that in these two environments some commodities may do well, and others may suffer. In the first scenario precious metals could potentially rise whereas energy markets continue to decline. In the second scenario, it is plausible to expect the opposite to occur. A similar theme has played out over recent years with gold providing strong performance in early 2020 as a risk-off trade while most other commodities sold off, and that theme reversing with energy broadly delivering strong performance for the two years following while gold languished, only for this to reverse again in the last six months. Dispersion in commodities is much higher than in other asset class, hence the potential need for a tactical approach.
In many agricultural markets, macroeconomic factors provide little influence compared to underlying supply and demand factors. Sugar and Soybeans futures, for example, don’t seem to be too affected by the recent rise in interest rates. In fact, we believe the rising rate environment has exacerbated the commodity challenges and surely does not increase short-term commodity supply nor incentivize long-term commodity infrastructure investments.
Final Thought
Choosing the right commodities to invest in, and when, is difficult. At Auspice we have more losing trades than winners, but our losses are considerably smaller and winners substantially bigger (“positive skew)”. Risk management is always prioritized. This is typically the case with most rules-based trend following Commodity Trading Advisors (“CTAs”) such as Auspice. Whereas many resource equity solutions are high risk, for CTAs risk management is a defining feature and substantial driver of long-term outperformance.
For a long-term perspective consider Auspice Diversified’s benchmark the BTOP50 CTA Index (Auspice has outperformed for 17 years) since its inception in 1987 versus benchmarks. The MSCI WCPI and TSX Cap Energy Indexes don’t have as much history, but we can compare performance against both traditional commodity benchmarks (BCOM & GSCI), Canadian equities (TSX 60) with a large resource equity tilt, and global equities (MSCI World).
The benefits are clear. Choose your exposure wisely.
Chart 4: Cumulative Performance CTAs Versus Commodity and Equity Benchmarks since Jan 1987
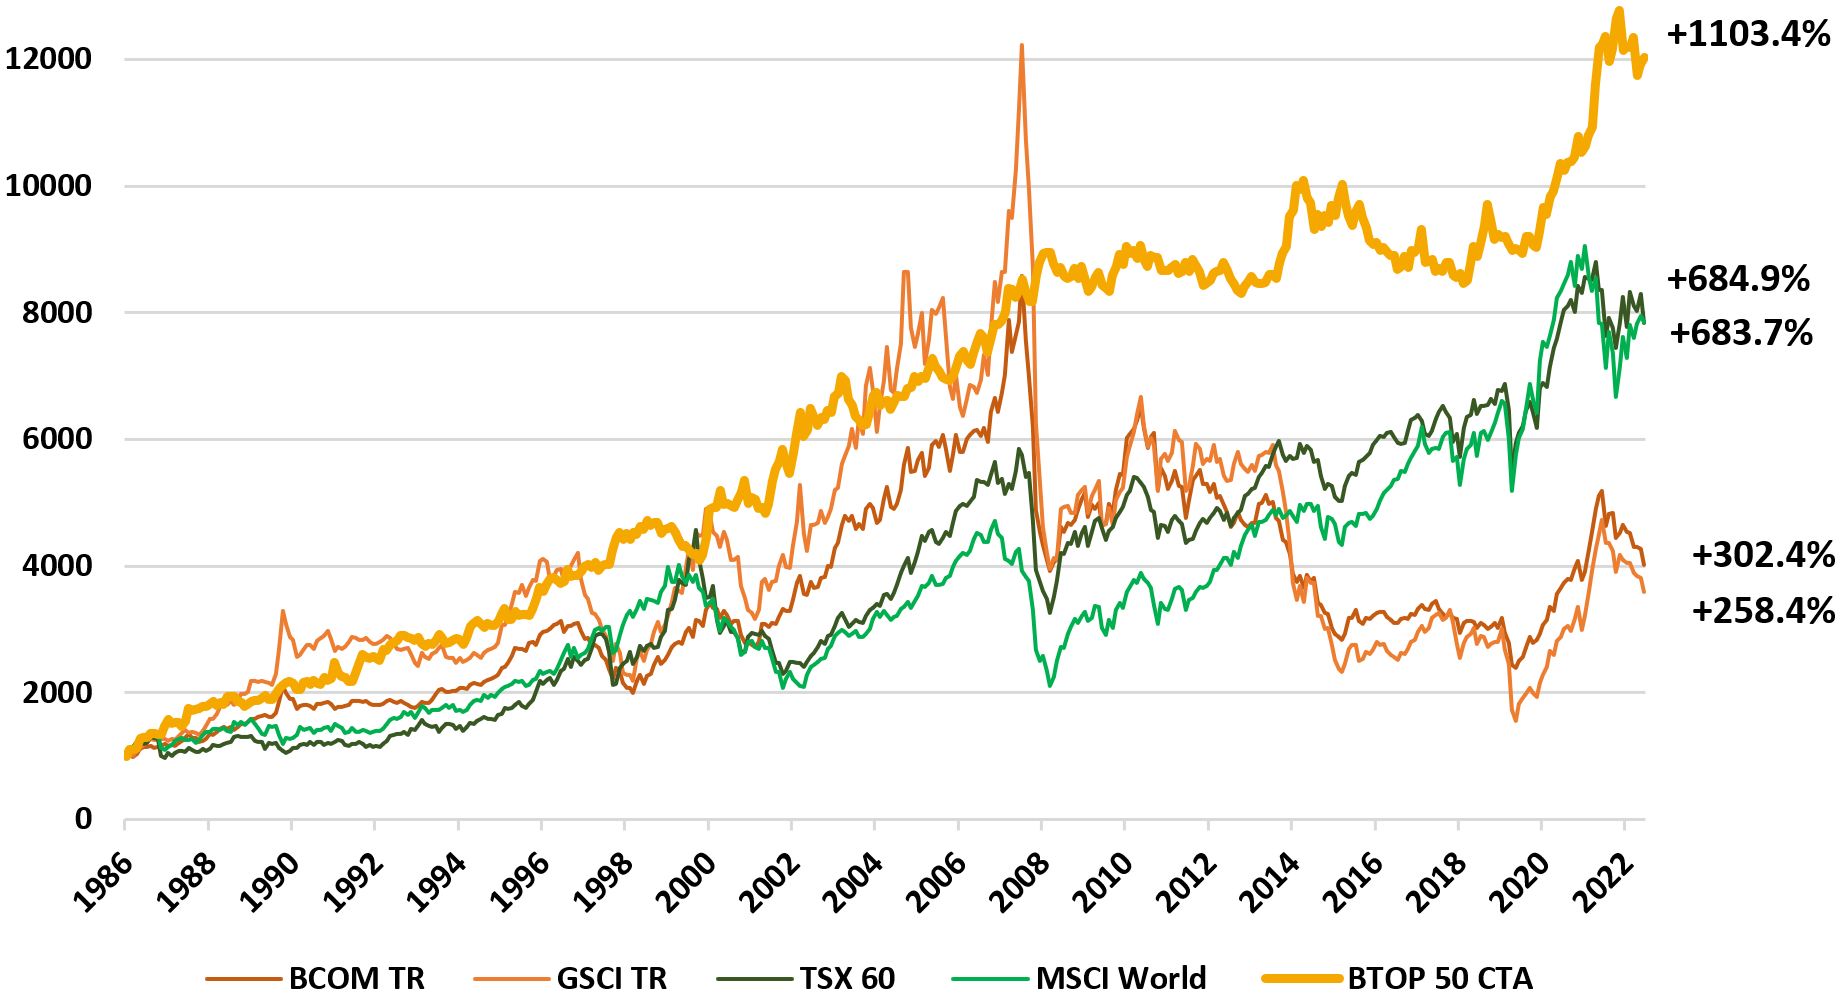
Source: Auspice Capital Advisors and Bloomberg, as at May 31st 2023. You cannot invest directly into an index. See index definitions and further disclaimers at the end. Past performance is not indicative of future results.
Table 2: CTAs Versus Commodity and Equity Benchmarks Since Jan 1987
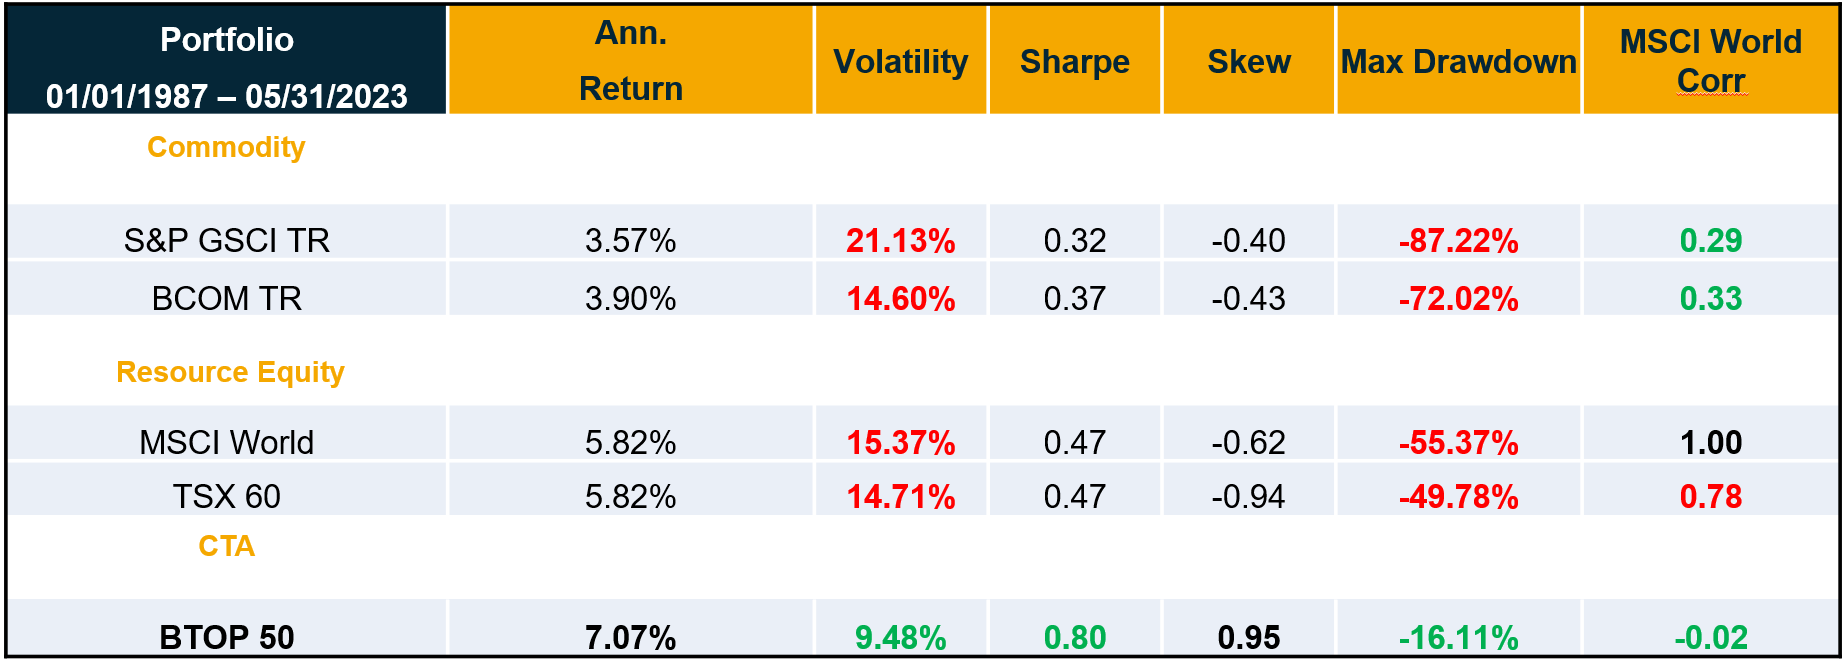
Source: Auspice Capital Advisors and Bloomberg, as at May 31st 2023. You cannot invest directly into an index. See index definitions and further disclaimers at the end. Past performance is not indicative of future results.
Disclaimers Below
BENCHMARK DESCRIPTIONS
· The BTOP50 seeks to replicate the overall composition of the managed futures industry with regard to trading style and overall market exposure. The largest investable trading advisor programs, as measured by assets under management, are selected for inclusion in the BTOP50. For 2022 there are 20 CTA funds in the Barclay BTOP50 Index. The BTOP 50 is the most comparable index for Auspice Diversified Trust, however there are significant differences, such as the average exposure to commodity futures (versus financial futures), and average trade length. Reference to the BTOP50 benchmark does not imply that Auspice Diversified Trust will achieve similar performance.
· The Bloomberg Commodity Index Excess Return (“BCOM ER”) Index is a broadly diversified commodity price index that tracks prices of futures contracts on physical commodities on the commodity markets. The Total Return version (“BCOM TR”) includes the return on cash. that is broadly diversified across the spectrum of commodities. As an index, the BCOM does not include any management or performance fees, which is not the same basis as the fund’s return. The Like Auspice Diversified Trust, the index is designed to minimize concentration in any one sector. No one commodity can compose more than 15% of the BCOM index, no one commodity and its derived commodities can compose more than 25% of the index, and no sector can represent more than 33% of the index. There are significant differences however, most importantly, that the BCOM ER index is passive, and 100% commodities, whereas Auspice Diversified Trust is active, and also trades financial futures. Reference to the BCOM ER benchmark does not imply that Auspice Diversified Trust will achieve similar performance.
· The (MSCI) World Index, Morgan Stanley Capital International, is designed to measure equity market performance large and mid-cap equity performance across 23 developed markets countries, covering approximately 85% of the free float-adjusted market capitalization in each. This index offers a broad global equity benchmark, without emerging markets exposure. As an index, the MSCI World does not include any management or performance fees, which is not the same basis as the fund’s return. There is a low degree of similarity between the MSCI World and Auspice Diversified Trust. As a main benchmark for global equity performance its inclusion is typically used to illustrate how Auspice Diversified Trust is notably different from global equities, an important consideration for portfolio managers and investors alike.
· The S&P Goldman Sachs Commodity Excess Return Index (“S&P GSCI ER”), is a composite index of commodity sector returns representing an unleveraged, long-only investment in commodity futures that is broadly diversified across the spectrum of commodities. The Total Return version (“S&P GSCI TR”) includes the return on cash. As an index, the GSCI does not include any management or performance fees, which is not the same basis as the fund’s return. Like Auspice Diversified, it provides exposure to a number of commodities. There are significant differences however. Importantly, the GSCI index is passive, concentrated in energy, and 100% commodities. Auspice Diversified Trust is active long and short, diversified equally across seven sectors, and also trades financial futures. Reference to the GSCI benchmark does not imply that Auspice Diversified Trust will achieve similar performance.
· The S&P/TSX 60 (“TSX60”) Index is a stock market index of 60 large companies listed on the Toronto Stock Exchange. Maintained by the Canadian S&P Index Committee, a unit of Standard & Poor’s, it exposes the investor to 60 stocks in nine industry sectors. As an index, the TSX60 World does not include any management or performance fees, which is not the same basis as the fund’s return. There is a low degree of similarity between the TSX 60 and Auspice Diversified Trust. As the main benchmark for equity performance in Canada its inclusion is typically used to illustrate how Auspice Diversified Trust is notably different from equities, an important consideration for portfolio managers and investors alike.
· The MSCI World Producers Index (MSCI WCPI) captures the global opportunity set of commodity producers in the energy, metal and agricultural sectors. Constituents are selected from the equity universe of MSCI World, the parent index, which covers large and mid cap securities across 23 Developed Markets (DM) countries. All index constituents are categorized in one of twelve sub-industries according to the Global Industry Classification Standard (GICS®), including: integrated oil & gas, oil & gas exploration & production, gold, steel, aluminum, precious metals & minerals, agricultural products, paper products, and forest products. As an index, the MSCI WCPI does not include any management or performance fees, which is not the same basis as the fund’s return. There is a low degree of similarity between the MSCI WCPI and Auspice Diversified Trust. As a main benchmark for resource equity performance its inclusion is typically used to illustrate how Auspice Diversified Trust is notably different from resource equities, an important consideration for portfolio managers and investors alike.
· The S&P/TSX Capped Energy (“TSX Cap Energy”) imposes capped weights on the index constituents included in the S&P/TSX Composite that are classified in the GICS® energy sector. As an index, the TSX Cap Energy does not include any management or performance fees, which is not the same basis as the fund’s return. There is a low degree of similarity between the TSX Cap Energy and Auspice Diversified Trust. As a main benchmark for resource equity performance its inclusion is typically used to illustrate how Auspice Diversified Trust is notably different from resource equities, an important consideration for portfolio managers and investors alike.
GLOSSARY & DEFINITIONS
· Commodity Trading Advisors (CTAs) are professional investment managers, similar to portfolio managers in mutual funds, who seek to profit from movements in the global financial, commodity and currency markets by investing in exchange traded futures, options, and OTC forward contracts.
· Standard deviation is a measure of how much an investment’s returns can vary from its average return. It is a measure of volatility and, in turn, risk.
· The Sharpe ratio measures the performance of an investment such as a security or portfolio compared to a risk-free asset, after adjusting for its risk. It is defined as the difference between the returns of the investment and the risk-free return, divided by the standard deviation of the investment returns.
· Skew is the degree to which returns are asymmetric around the mean. Why does skew matter? If portfolio returns are right, or positively, skewed, it implies numerous small negative returns and a few large positive returns. If portfolio returns are left, or negatively, skewed, it implies numerous small positive returns and few large negative returns.
· Max Drawdown measures the maximum fall in the value of the investment, as given by the difference between the value of the lowest trough and that of the highest peak before the trough.
· Correlation “Corr” is a statistical measure that calculates the degree to which two portfolio or securities move in relation to one and the other, and can range between -1.0 and +1.0. A 0 correlation would indicate 0 similarity, a 1.0 correlation would indicate 100% correlation.
IMPORTANT DISCLAIMERS AND NOTES
Prior to February 28, 2023, Auspice Diversified Trust was offered via offering memorandum only and this Fund was not a reporting issuer during such prior period. The expenses of the Fund would have been higher during such prior period had the Fund been subject to the additional regulatory requirements applicable to a reporting issuer. Auspice obtained exemptive relief on behalf of the Fund to permit the disclosure of the prior performance data for the Fund for the time period prior to it becoming a reporting issuer.
Commissions, trailing commissions, management fees and expenses may all be associated with investment funds. Please read the prospectus before investing. Investment funds are not guaranteed, their values change frequently and past performance may not be repeated.
The contents on this website are provided for informational and educational purposes and are not intended to provide specific individual advice including, without limitation, investment, financial, legal, accounting and tax. Please consult with your own professional advisor on your particular circumstances.
Futures trading is speculative and is not suitable for all customers. Past results are not necessarily indicative of future results. This document is for information purposes only and should not be construed as an offer, recommendation or solicitation to conclude a transaction and should not be treated as giving investment advice. Auspice Capital Advisors Ltd. makes no representation or warranty relating to any information herein, which is derived from independent sources. No securities regulatory authority has expressed an opinion about the securities offered herein and it is an offence to claim otherwise. Please read the offering documents before investing.
Certain statements in this document are forward- looking statements, including those identified by the expressions “anticipate”, “believe”, “plan”, “estimate”, “expect”, “intend”, “target”, “seek”, “will” and similar expressions to the extent they relate to the Fund and the Manager. Forward- looking statements are not historical facts but reflect the current expectations of the Fund and the Manager regarding future results or events. Such forward-looking statements reflect the Fund’s and the Manager’s current beliefs and are based on information currently available to them. Forward-looking statements are made with assumptions and involve significant risks and uncertainties. Although the forward-looking statements contained in this document are based upon assumptions that the Fund and the Manager believe to be reasonable, none of the Fund or the Manager can assure investors that actual results will be consistent with these forward-looking statements. As a result, readers are cautioned not to place undue reliance on these statements as a number of factors could cause actual results or events to differ materially from current expectations.
The forward-looking statements contained herein were prepared for the purpose of providing prospective investors with general educational background information about the Funds and may not be appropriate for other purposes. None of the Fund or the Manager assumes any obligation to update or revise them to reflect new events or circumstances, except as required by law.
This blog may contain hypertext links to web sites owned and controlled by other parties than Auspice. We have no control over any third-party-owned web sites or content referred to, accessed by or available on this web site and therefore we do not endorse, sponsor, recommend or otherwise accept any responsibility for such third-party web sites or content or for the availability of such web sites. In particular, we do not accept any liability arising out of any allegation that any third-party-owned content (whether published on this or any other web site) infringes the intellectual property rights of any person, or any liability arising out of any information or opinion contained on such third-party web site or content.