Publication Date: July 6th 2023
In the Auspice May blog “Agflation” we highlighted a number of commodity food markets breaking out to 10+ year highs. Agricultural commodities continued upwards in June making 12 months highs, and the recent divergence and softening in both food prices is likely temporary in our opinion. Importantly, we expect this to lead to a bottoming and potential reversal of broader inflation metrics. See Chart 1 below.
Chart 1: Agricultural Commodities Versus Food Prices Since 2020

Source: Auspice Capital and Bloomberg
After a strong two-year period of performance commodities broadly, particularly headline energy and precious metals markets, have consolidated, if not retraced since May 2022 highs. However, as you’ve likely heard from Auspice previously, there’s a lot more to commodities than oil and gold. Headline energy and precious metals markets and accordingly mainstream news coverage largely has missed the divergence that has taken place over the last year in many agricultural markets. See Chart 2 below.
Chart 2: Agricultural Commodities Versus the Goldman Sachs (GSCI) Commodity Benchmark
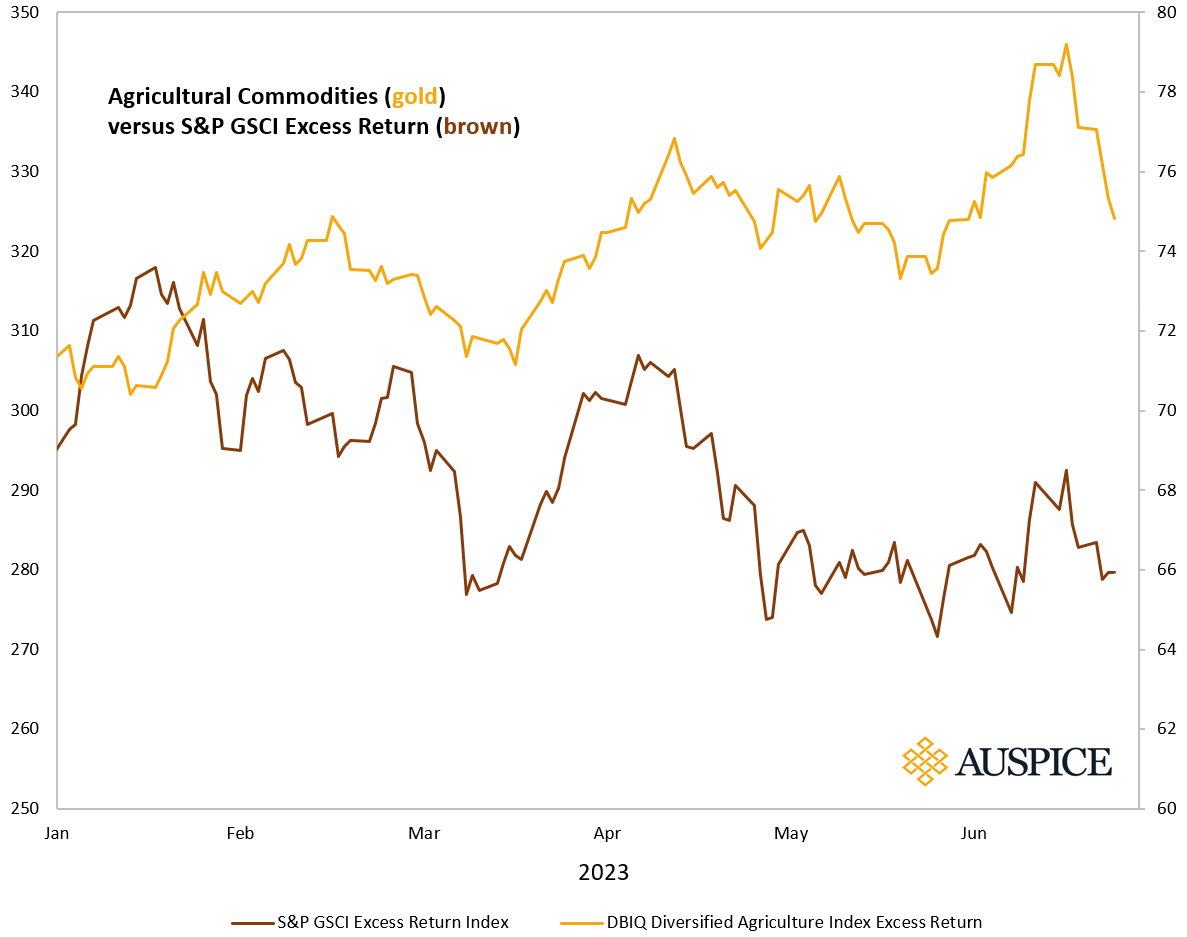
Source: Auspice Capital and Bloomberg
Notably, in May 2023 Sugar, Coffee, Cattle, and Orange Juice all made decade plus highs.
That was just a start…
Grains
Weather shocks sent crop prices into volatile gyrations with soybeans, canola and wheat soaring in June. As the growing season kicked off in June, 64% of the US corn crop was covered by drought[1], the worst drought since 2012[2]. Notably, US corn yields were the lowest in 17 years according to the US Department of Agriculture (USDA) [3].
Figure 1: US Drought Map June 20th 2023
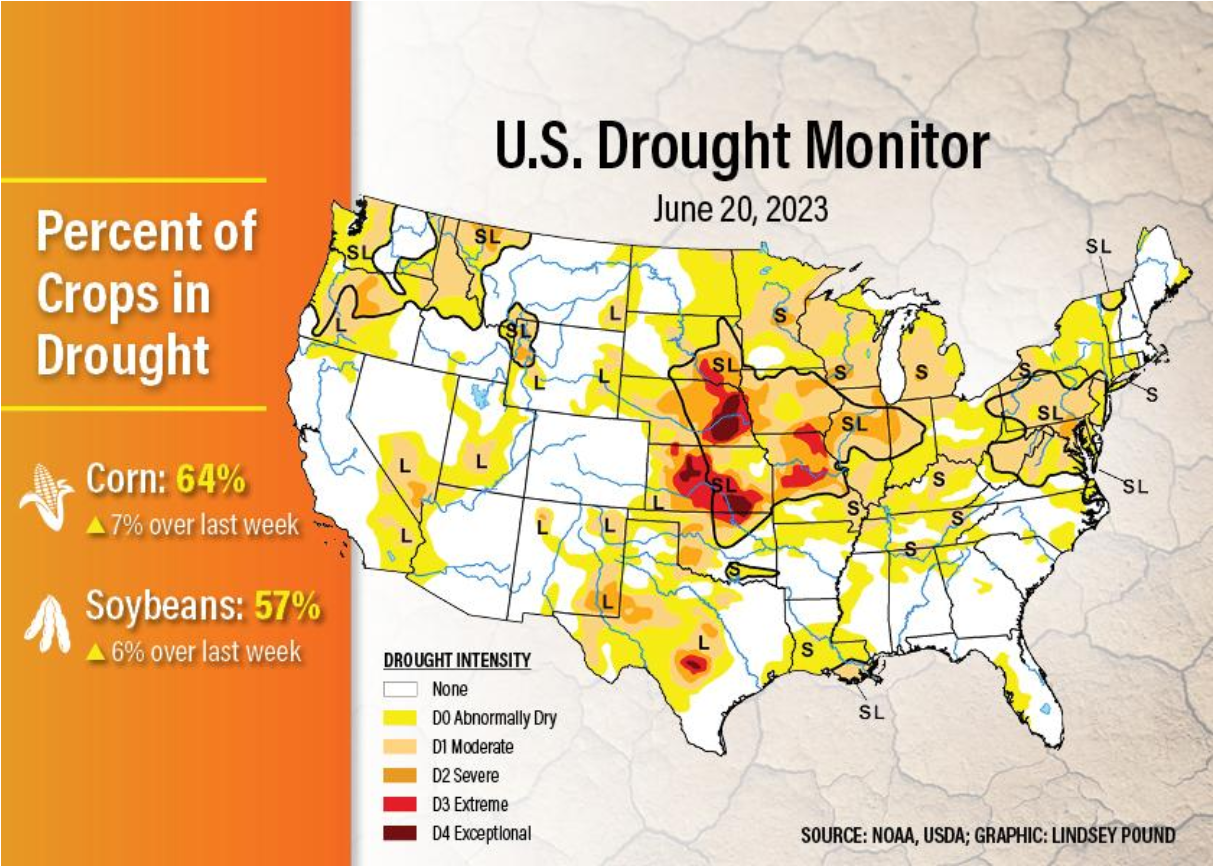
Source: https://www.agweb.com/news/crops/crop-production/drought-watch-64-us-corn-crop-now-covered-drought
Cocoa
Cocoa prices made a 46-year price high on June 27th[4]. This season will mark the second consecutive deficit with cocoa supply expected to dwindle to unusually low levels”[5]. The cocoa market is expected to face another deficit in the subsequent season, which runs from October to September next year, and that means cocoa futures could surge”[6].
Wheat
In Ukraine flooding caused by the destroyed Kakhovka dam could pose a severe risk to agricultural markets. The dam and reservoir is in the middle of Ukraine’s traditional main wheat growing area and is a major source of farm irrigation. Reduced Ukrainian planted area coupled with lower yields will weigh on the 2023/24 harvest[7].
China’s wheat imports are already at a record pace, year-to-date imports are 60% higher than similar time frames in 2021 and 2022, which were both record import years.[8] The increase in wheat imports comes as China has undergone a structural shift to become a major net importer of grains[9].
In Australia a 30% year-over-year drop in production to 26.2 million tonnes is expected.[10]
Currently global wheat ending stocks, outside of China, are at their lowest level since 2008/09 with little anticipated build in 2023/24 ending stocks.[11]
Agflation
From coffee to cattle, corn to cocoa, agricultural markets are either making multi-year highs, or on the precipitous of doing so with dire fundamental supply shortages.
The Commodity Supercycle
The commodity supercycle is in its early innings in our opinion, and the appreciation that took place between the summer of 2020 and spring 2022 is likely just the initial phase of a much larger cycle. To date much of the Auspice research has focused on commodity supply shortages in the more capex intensive metals and energies sectors, where there has been over a decade of underinvestment in the space, and expansion of infrastructure is typically a 7-10 year cycle or more. See Charts 3 and 4 below.
Chart 3: Decade of Decline in Energy Capex
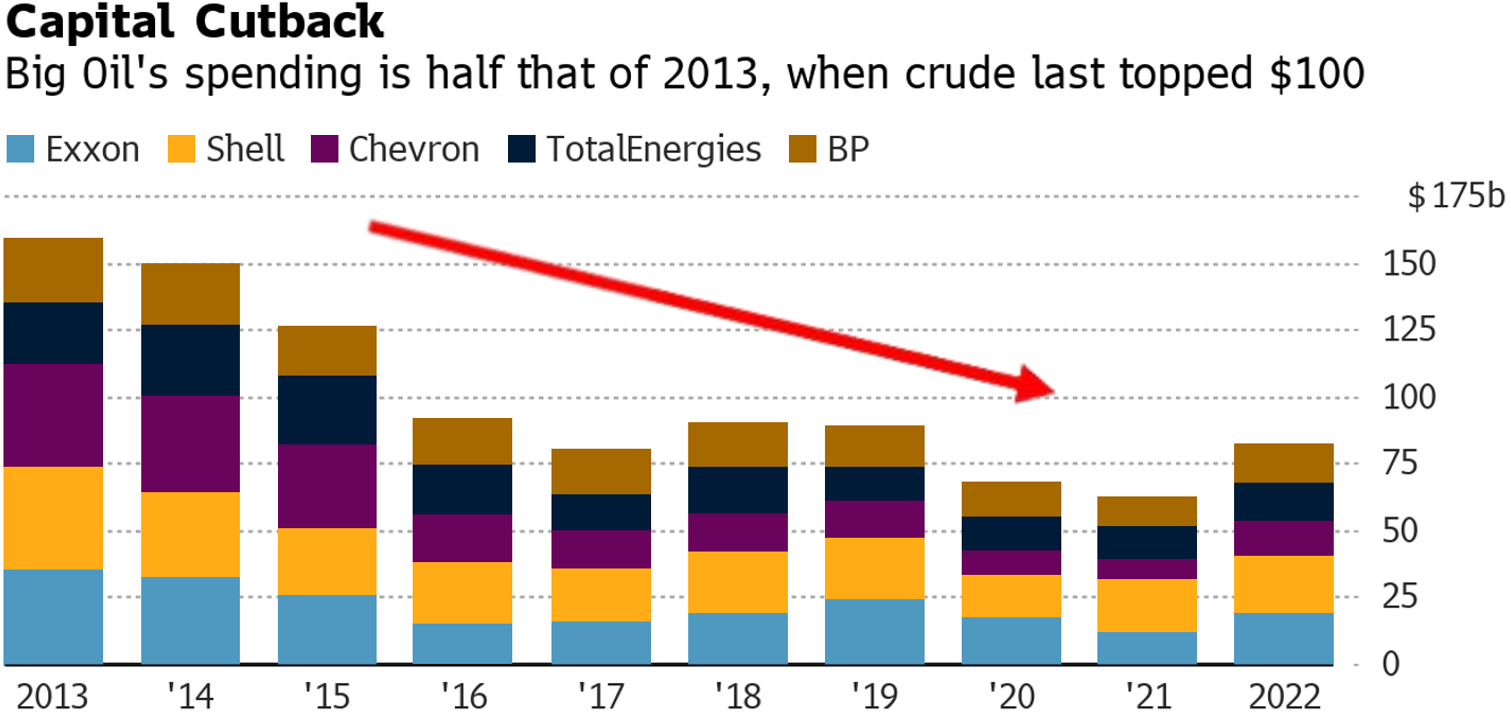
Source: https://www.bloomberg.com/news/articles/2022-05-07/big-oil-spends-on-investors-not-output-prolonging-crude-crunch
Chart 4: Decade of Decline in Metals and Miners’ Capex
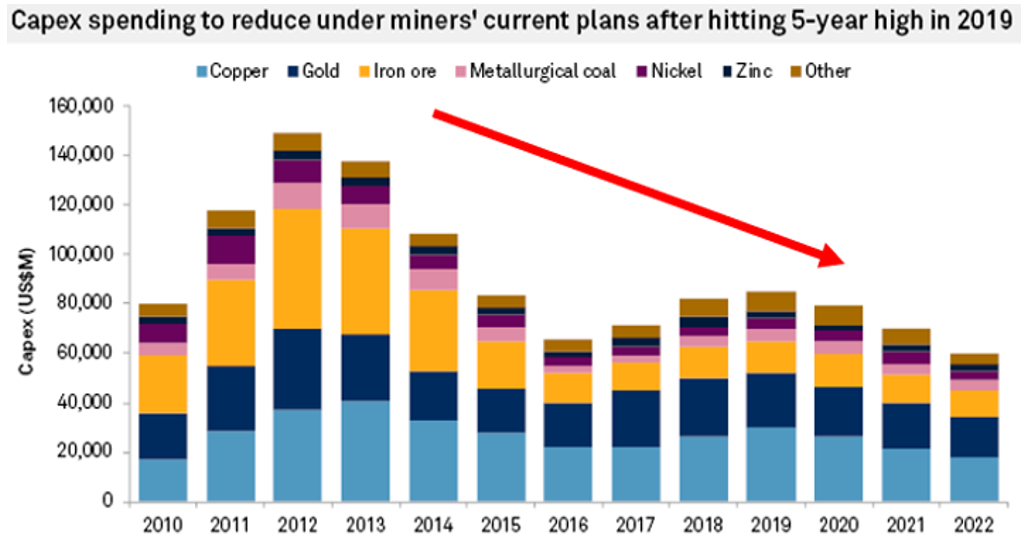
Source: S&P Global Market Intelligence
Agflation however is emerging as yet another commodity supercycle driver on the back of supply shortages consistent with the more capex intensive energy and metals sectors. Indeed, as the world population continues to grow, the share of cropland used to grow food for people is declining[12].
“The global population is increasing at a rapid rate. This growing population is adding to the food demand. Supplying food to this growing population has become a threat. On the other hand, arable land is declining due to industrialization and urbanization”[13]
Figure 2: 2020s Commodity Supercycle Drivers
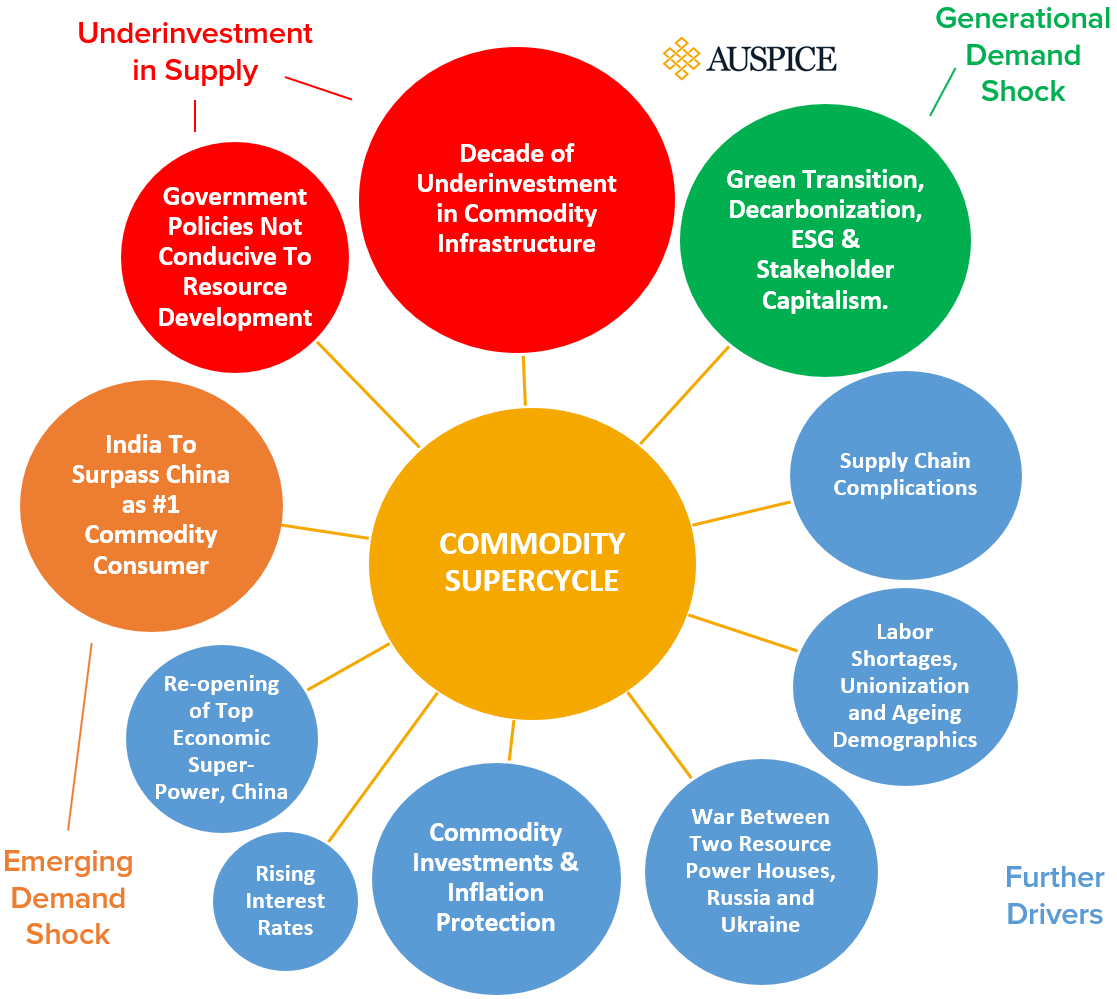
Source: Auspice Capital
Timing & Adding Exposure
In June Auspice again reached new all time AUM highs. After two years of strong performance in traditional and active commodity solutions, there has been consolidation, consistent with any long-term cycle. Forward-thinking investors appear to be taking advantage of the opportunity to add exposure following consolidation.
As always, we remind investors that risk management is job#1 with commodities in our opinion. Traditional commodity indexes and products linked to those have delivered equity like returns throughout history, but with considerably high volatility and drawdown. See “Full Cycle Performance” in Table 1 below, and last month’s blog for more on commodity risk.
Table 1: Commodity and Equity Performance Since Goldman Sachs (GSCI) Commodity Index Inception
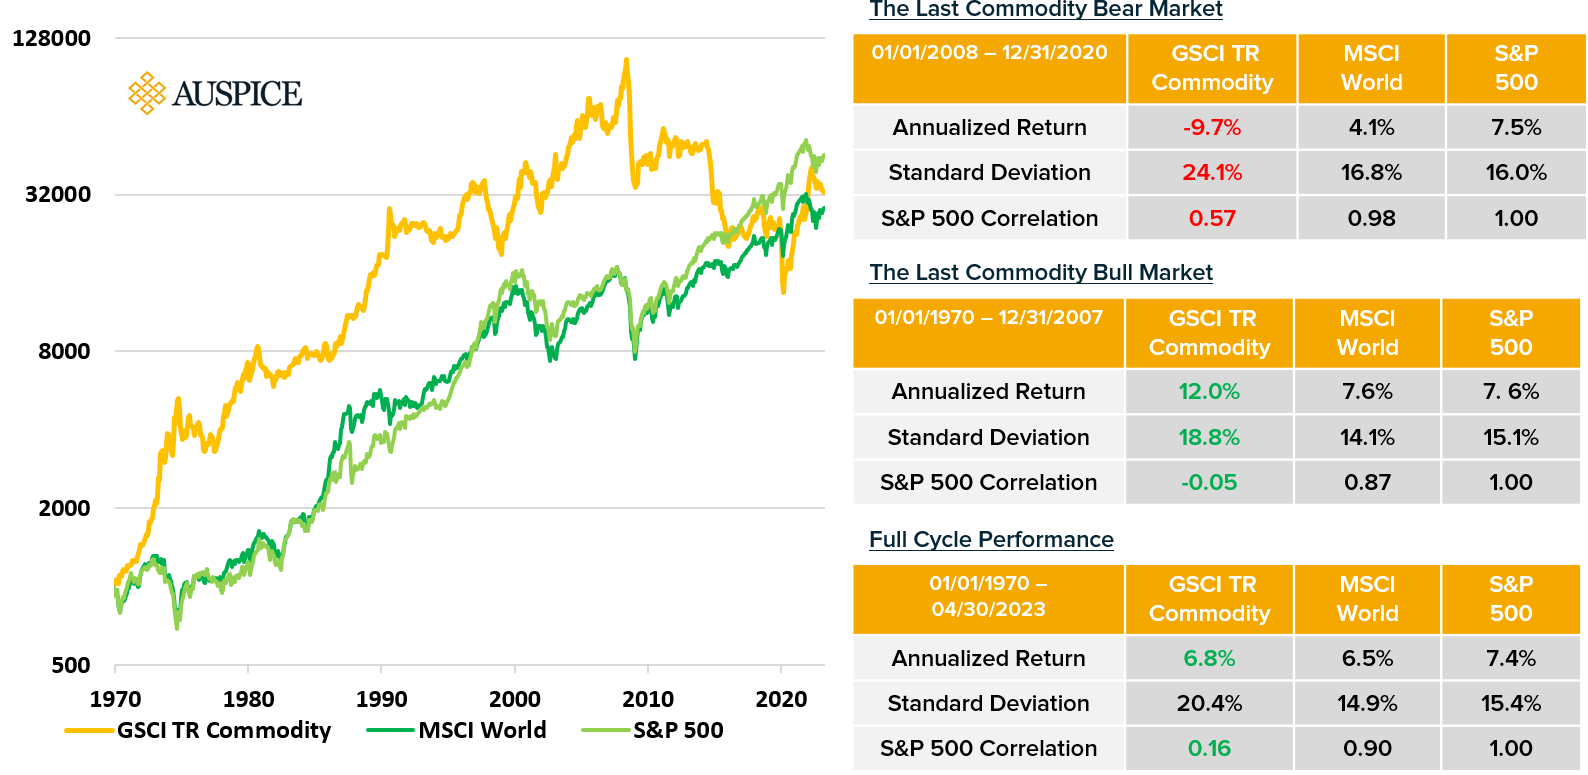
Source: Auspice Capital and Bloomberg
If not clear by this point, we reiterate: we are bullish broadly on commodities long term. If there is one thing we at Auspice are most confident in however it is that with over a decade of declining stocks of commodities, volatility will persist. The opportunity for tactical commodity trading strategies is likely in its early innings.
Forward thinking institutional investors such as Ontario Teachers’ pension have made allocations >10% of portfolio[14]. Many of the largest US public pensions have 5-10% of the portfolio allocated to Commodity Trading Advisors[15]. If you don’t have a meaningful allocation to commodity or CTA strategies or have any questions you can email us at info@auspicecapital.com for further information.
Disclaimers Below
BENCHMARK DESCRIPTIONS
· The Bloomberg Commodity Index Excess Return (“BCOM ER”) Index is a broadly diversified commodity price index that tracks prices of futures contracts on physical commodities on the commodity markets. The Total Return version (“BCOM TR”) includes the return on cash. that is broadly diversified across the spectrum of commodities. As an index, the BCOM does not include any management or performance fees, which is not the same basis as the fund’s return. The Like Auspice Diversified Trust, the index is designed to minimize concentration in any one sector. No one commodity can compose more than 15% of the BCOM index, no one commodity and its derived commodities can compose more than 25% of the index, and no sector can represent more than 33% of the index. There are significant differences however, most importantly, that the BCOM ER index is passive, and 100% commodities, whereas Auspice Diversified Trust is active, and also trades financial futures. Reference to the BCOM ER benchmark does not imply that Auspice Diversified Trust will achieve similar performance.
· The (MSCI) World Index, Morgan Stanley Capital International, is designed to measure equity market performance large and mid-cap equity performance across 23 developed markets countries, covering approximately 85% of the free float-adjusted market capitalization in each. This index offers a broad global equity benchmark, without emerging markets exposure. As an index, the MSCI World does not include any management or performance fees, which is not the same basis as the fund’s return. There is a low degree of similarity between the MSCI World and Auspice Diversified Trust. As a main benchmark for global equity performance its inclusion is typically used to illustrate how Auspice Diversified Trust is notably different from global equities, an important consideration for portfolio managers and investors alike.
· The S&P Goldman Sachs Commodity Excess Return Index (“S&P GSCI ER”), is a composite index of commodity sector returns representing an unleveraged, long-only investment in commodity futures that is broadly diversified across the spectrum of commodities. The Total Return version (“S&P GSCI TR”) includes the return on cash. As an index, the GSCI does not include any management or performance fees, which is not the same basis as the fund’s return. Like Auspice Diversified, it provides exposure to a number of commodities. There are significant differences however. Importantly, the GSCI index is passive, concentrated in energy, and 100% commodities. Auspice Diversified Trust is active long and short, diversified equally across seven sectors, and also trades financial futures. Reference to the GSCI benchmark does not imply that Auspice Diversified Trust will achieve similar performance.
GLOSSARY & DEFINITIONS
· The DBIQ Diversified Agriculture Index Excess Return is a rules-based index composed of futures contracts on some of the most liquid and widely traded agricultural commodities.
· The UN Food and Agriculture World Food Price Index (FAO Food Price Index) is a food price index by the Food and Agriculture Organization (FAO) of the United Nations. It records the development of world market prices of 55 agricultural commodities and foodstuffs.
· Commodity Trading Advisors (CTAs) are professional investment managers, similar to portfolio managers in mutual funds, who seek to profit from movements in the global financial, commodity and currency markets by investing in exchange traded futures, options, and OTC forward contracts.
· Standard deviation is a measure of how much an investment’s returns can vary from its average return. It is a measure of volatility and, in turn, risk.
· The Sharpe ratio measures the performance of an investment such as a security or portfolio compared to a risk-free asset, after adjusting for its risk. It is defined as the difference between the returns of the investment and the risk-free return, divided by the standard deviation of the investment returns.
· Skew is the degree to which returns are asymmetric around the mean. Why does skew matter? If portfolio returns are right, or positively, skewed, it implies numerous small negative returns and a few large positive returns. If portfolio returns are left, or negatively, skewed, it implies numerous small positive returns and few large negative returns.
· Max Drawdown measures the maximum fall in the value of the investment, as given by the difference between the value of the lowest trough and that of the highest peak before the trough.
· Correlation “Corr” is a statistical measure that calculates the degree to which two portfolio or securities move in relation to one and the other, and can range between -1.0 and +1.0. A 0 correlation would indicate 0 similarity, a 1.0 correlation would indicate 100% correlation.
IMPORTANT DISCLAIMERS AND NOTES
Prior to February 28, 2023, Auspice Diversified Trust was offered via offering memorandum only and this Fund was not a reporting issuer during such prior period. The expenses of the Fund would have been higher during such prior period had the Fund been subject to the additional regulatory requirements applicable to a reporting issuer. Auspice obtained exemptive relief on behalf of the Fund to permit the disclosure of the prior performance data for the Fund for the time period prior to it becoming a reporting issuer.
Commissions, trailing commissions, management fees and expenses may all be associated with investment funds. Please read the prospectus before investing. Investment funds are not guaranteed, their values change frequently and past performance may not be repeated.
The contents on this website are provided for informational and educational purposes and are not intended to provide specific individual advice including, without limitation, investment, financial, legal, accounting and tax. Please consult with your own professional advisor on your particular circumstances.
Futures trading is speculative and is not suitable for all customers. Past results are not necessarily indicative of future results. This document is for information purposes only and should not be construed as an offer, recommendation or solicitation to conclude a transaction and should not be treated as giving investment advice. Auspice Capital Advisors Ltd. makes no representation or warranty relating to any information herein, which is derived from independent sources. No securities regulatory authority has expressed an opinion about the securities offered herein and it is an offence to claim otherwise. Please read the offering documents before investing.
Certain statements in this document are forward- looking statements, including those identified by the expressions “anticipate”, “believe”, “plan”, “estimate”, “expect”, “intend”, “target”, “seek”, “will” and similar expressions to the extent they relate to the Fund and the Manager. Forward- looking statements are not historical facts but reflect the current expectations of the Fund and the Manager regarding future results or events. Such forward-looking statements reflect the Fund’s and the Manager’s current beliefs and are based on information currently available to them. Forward-looking statements are made with assumptions and involve significant risks and uncertainties. Although the forward-looking statements contained in this document are based upon assumptions that the Fund and the Manager believe to be reasonable, none of the Fund or the Manager can assure investors that actual results will be consistent with these forward-looking statements. As a result, readers are cautioned not to place undue reliance on these statements as a number of factors could cause actual results or events to differ materially from current expectations.
The forward-looking statements contained herein were prepared for the purpose of providing prospective investors with general educational background information about the Funds and may not be appropriate for other purposes. None of the Fund or the Manager assumes any obligation to update or revise them to reflect new events or circumstances, except as required by law.
This blog may contain hypertext links to web sites owned and controlled by other parties than Auspice. We have no control over any third-party-owned web sites or content referred to, accessed by or available on this web site and therefore we do not endorse, sponsor, recommend or otherwise accept any responsibility for such third-party web sites or content or for the availability of such web sites. In particular, we do not accept any liability arising out of any allegation that any third-party-owned content (whether published on this or any other web site) infringes the intellectual property rights of any person, or any liability arising out of any information or opinion contained on such third-party web site or content.
References
[1] https://www.agweb.com/news/crops/crop-production/drought-watch-64-us-corn-crop-now-covered-drought
[2] https://www.reuters.com/world/us/central-us-drought-intensifies-threatening-grains-soy-2023-06-22/
[3] https://www.reuters.com/world/us/central-us-drought-intensifies-threatening-grains-soy-2023-06-22/
[4] https://www.reuters.com/markets/commodities/chocolate-making-ingredient-cocoa-hits-highest-price-46-years-2023-06-28/
[5] https://www.cnbc.com/2023/06/13/chocolate-is-set-to-get-more-expensive-as-cocoa-prices-soar-to-seven-year-highs.html
[6] https://www.cnbc.com/2023/06/13/chocolate-is-set-to-get-more-expensive-as-cocoa-prices-soar-to-seven-year-highs.html
[7] https://www.gro-intelligence.com/insights/wheat-prices-gyrate-on-ukraine-dam-destruction-and-australia-production-forecast?
[8] https://www.gro-intelligence.com/insights/drenching-rains-seen-driving-china-wheat-imports-higher?
[9] https://www.gro-intelligence.com/insights/drenching-rains-seen-driving-china-wheat-imports-higher?
[10] https://www.gro-intelligence.com/insights/wheat-prices-gyrate-on-ukraine-dam-destruction-and-australia-production-forecast?
[11] https://www.gro-intelligence.com/insights/wheat-prices-gyrate-on-ukraine-dam-destruction-and-australia-production-forecast?
[12] https://www.wri.org/insights/crop-expansion-food-security-trends
[13] https://www.businesswire.com/news/home/20220713005612/en/Global-Fertilizers-Industry-Assessment-2022-2027-Decreasing-Per-Capita-Arable-Land-and-Increasing-Food-Demand---ResearchAndMarkets.com
[14] https://static1.squarespace.com/static/53a1ca9ce4b030ded763dbc2/t/61893c333a527d3e6536ffa2/1636383796359/Commodities+%26+CTAs+Case+Study%2C+US+Pensions+%26+Ontario+Teachers%27+-+Auspice.pdf
[15] https://static1.squarespace.com/static/53a1ca9ce4b030ded763dbc2/t/61893c333a527d3e6536ffa2/1636383796359/Commodities+%26+CTAs+Case+Study%2C+US+Pensions+%26+Ontario+Teachers%27+-+Auspice.pdf